Introduction
The global retail industry is one of the most vital sectors in the world, providing various categories of goods to consumers. Tesco is a multinational company operating in the United Kingdom managing multiple groceries and general merchandise. Established in 1919, this corporation’s shares have been listed in the London Stock Exchange (Rosnizam et al., 2020). Apart from America’s Walmart, this English-based consortium has 2,300 supermarkets and other convenience stores and recruits about 326,000 employees (Rosnizam et al., 2020). However, in continental regions, the company operates in countries such as Slovakia, Turkey, Poland, Czech Republic, and many others. It has multiple business units but especially provides financial services through its subsidiary, Tesco Financial Services which manages 4.6 million clients account segmented between car insurance policies and credit cards. During the early years of the 21st century, Tesco introduced its e-commerce platform which heightened its financial growth. This paper analyzes the financial position of Tesco using liquidity, efficiency, investment, and profitability ratios and suggests ways in which investors can make profits from a potential investment in Tesco’s shares.
Company Performance in its Industry Sector
The grocery market comprises several organizations competing against each other. In the United Kingdom, both Sainsbury’s and Tesco had the most significant market share accounting for approximately 42.3% as of May 2021 (Appelbaum et al., 2017). Tesco accumulated an annual revenue of 53 billion GBP in Ireland and Great Britain particularly in its 2019/2020 financial year. As compared to its previous year, the multinational retailer recorded an increase of approximately 1.3 billion GBP (Brigham & Houston, 2021). In addition, the corporation developed a strategic management model referred to as the Corporate Steering Wheel which enabled it to deliver its strategy and enhance its enterprise performance. In particular, this strategic tool has four components such as finance, people, operations, and customer. Each of these elements encompasses several strategic objectives that accentuate the priorities of the firm.
Competition
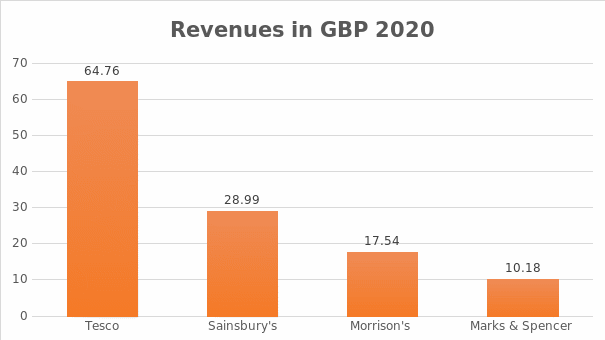
Tesco is a global-based company which is among the Big Four in Great Britain. Its core competitors are supermarkets such as ASDA, Sainsbury’s, and Morrison’s. However, its other rivals in the retail segment operating the United States are retailers such as Walmart, Amazon, Walgreens, and Home Depot. Tesco has managed to maintain peak performance in its home country by focusing on both its employees and the customers. In essence, this firm outperformed its core rivals in the United Kingdom market having accounted for approximately 64.76 billion GBP in revenue (Cokins, 2017). Its competitors Sainsbury’s, Morrison’s and Marks and Spencer Foods accumulated sales revenue of 28.99, 17.54, and 10.18 billion GBP respectively as illustrated in the bar graph below.

Key Areas for Investment
Tesco is an exceptional organization in the retail segment that a potential investor can consider investing by purchasing its shares. However, before considering this financial decision, a shareholder should first have a comprehensive understanding of the key aspects that drive the operations and performance of the UK leading supermarket. As such, several financial ratios can be utilized to assess the feasibility of investment by examining various components such as liquidity, profitability, efficiency, and investment options of the company.
Liquidity Ratios
Organizational liquidity refers to the ability of a company to easily turn its asset or security into cash without compromising its market price. As such, cash is considered the most liquid resource while tangible commodities are less liquid. In essence, liquidity ratios are imperative to stockholders and credits because it helps in determining if a corporation can settle their immediate debts (Davis & Davis, 2019). In particular, there are two types of liquidity metrics that can used such as quick and current ratio.
Quick Ratio or Acid Test
A quick ratio is a metric used by financial advisors to compute the ability of a firm to manage its short-term settlement of obligation while utilizing its most liquid assets. It is calculated by dividing the difference between current assets and inventories by a corporation’s current liabilities. Tesco’s current liabilities as of August 31, 2020 was $23.58 billion whereas its current assets minus inventories equal $18.86 billion (Guo & Wang, 2019). Therefore, its quick ratio for this particular period was 0.80.
Current Ratio
Current ratio is a metric used by financial advisors to calculate the liquidity of an organization by dividing the current assets by the current liabilities. It informs shareholders and market analysts how a corporation can capitalize on the current asset to meet its debt and other account payables. In Tesco’s case, its current assets accounted for approximately $21.74 billion whereas its current liabilities were reportedly $23.58 billion as of August 31, 2020 (Jiambalvo, 2019). Therefore, during this time, the UK supermarket’s current ratio was 0.92.
Profitability Ratios
Profitability ratios are used in organizational management to gauge the ability of a company to make income relative to expenses, operating costs, and balance sheet assets. These metrics indicate how well a corporation exploit its assets to generate profits and create value for its investors (Cokins, 2017). There are several profitability ratios which can be used to evaluate Tesco such as gross profit, net profit, mark up, and return on capital employed.
Gross Profit
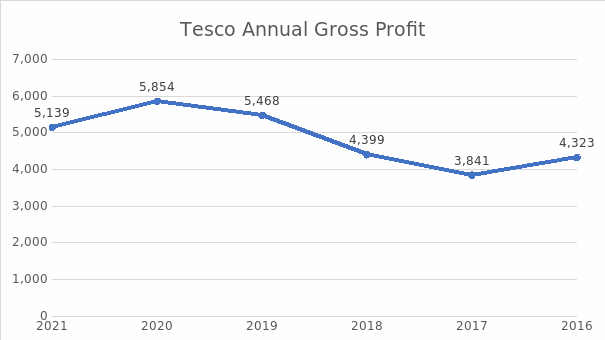
Gross profit can be described as the amount of money a firm generates after subtracting the variable expenses directly associated with producing and retailing its goods or providing its services. Tesco’s gross profit for the year ended 2020 was approximately $5.854 billion which is an increase from the amount recorded in 2019 (Shapiro & Hanouna, 2019). In particular, the figure below is a graph illustrating the gross profits the UK firm has been making since 2015.

Net Profit
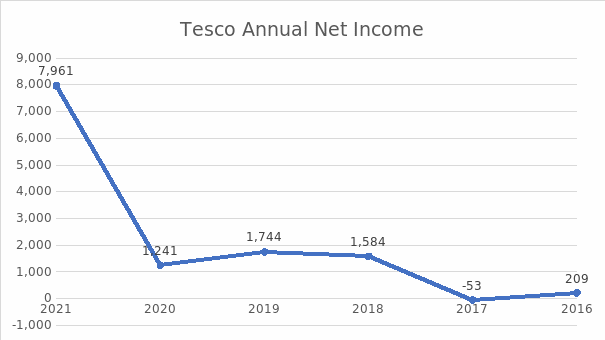
Net profit is a metric that indicates the amount of money a company has after multiple expenses have been deducted from revenue. examples of these outlays include taxes, operating expenses, interest, and many more. In Tesco’s case, its net income can be illustrated in a line graph that shows whether the supermarket has been making either profits or losses. Since 2016, Tesco annual net profit has been steadily increasing except for 2017 when the company made losses of approximately $5.3 million (Rosnizam et al., 2020). Following these losses, Tesco improved its performance which was reflected in a consistent rise in income, thereby making a significant $7.961 billion in 2021.

Return on Capital Employed
Return on Capital Employed (ROCE) is a financial metric that enables managers to evaluate an organization’s lucrativeness and capital efficiency. In particular, this ratio is essential in gaining insight into how well a corporation is making income from its capital. Renowned investment analyst Michael Mauboussin implied that a high ROCE shows that one dollar invested in the organization brings value of at least $1 (Weygandt et al., 2018). Therefore, this metric can be computed by dividing Earnings Before Interest and Tax (EBIT) by the difference between total assets and current liabilities. Therefore, in Tesco’s case, its ROCE equals:
ROCE = $2.95 billion ÷ ($68.85 billion – $29.51) (Reflecting the trailing twelve months (TTM) to February 2019)
Therefore, the UK supermarket had a ROCE of 7.4%.
When investors are comparing between various companies, they find the ROCE important. As such, Tesco’s Return on Capital Employed is approximately 7.4% as estimated by the Consumer Retailing industry. However, from the market comparison, Tesco’s figures are considered average, considering the risk associated with stocks versus bank account safety (Weygandt et al., 2018). Shareholders may wish to consider higher performing portfolio before deciding on the stocks to use. The analysis above finds that Tesco’s 7.4% is an increase from the percentage it recorded three years ago, when its ROCE was approximately 3.0% thereby suggesting the its firm performance has been improving.
Investment/Gearing
Dividend Yield and Cover
Dividend yield can be calculated by dividing the annual dividend per share by the current share price. In Tesco’s case, its total dividends of 9.15 can be divided by its current share price of 227.40 to get a dividend yield of 4.02%. In contrast, dividend coverage is a financial tool utilized by managers to evaluate the extent to which a company can pay dividends to its stockholders (Cokins, 2017). Tesco has a dividend coverage of 1.20 and this suggests that the retail is able to fund the payout from its earning without dependence on external sources of funds.
Earnings Per Share (EPS) and Price/Earnings Ratio (P/E)
Earnings per share is an expression of an organization’s income dividend by the outstanding shares of its stock. Tesco’s EPS over the last five years has been consistent except for 2017 when the figure recorded was a negative since it made losses. Figure 4 below indicates a line graph illustrating the UK supermarket’s EPS over the years. In contrast, price/earnings ratio exhibits the relationship between a firm’s earnings per share and stock price (Davis & Davis, 2019). As of today, Tesco’s share price is £227.40 whereas its EPS for the TTM ended February 2021 was £1.87. Therefore, the UK giant’s P/E ratio equals 121.60.
Capital Gearing
In the United Kingdom, capital gearing is a phrase used to describe the amount of debt a corporation has in relation to its equity. However, in the United States, this concept is alternatively referred to as financial leverage. It is calculated by dividing common stockholders’ equity by fixed interest-bearing funds. This metric is significant for investors because it helps them compare whether a corporation is holding an appropriate capital structure or not (Guo & Wang, 2019). As of February 2021, Tesco’s common stockholders’ equity was valued at $17.119 billion.
Efficiency Ratios
Non-Current Assets Turnover
Organizations use non-current assets turnover as an efficiency metric to measure the revenue generated relative to non-current assets. It is calculated by dividing the revenue with the non-current assets. Generally, a low non-current assets turnover suggests that a corporation to not effectively utilizing its assets while a high ratio may indicate that a company is more efficient in making the most of its non-current assets. Therefore, Tesco’s non-current asset turnover is as follows:
£64.76 billion ÷ £39.138 billion = 1.655
Trades Receivables Collection Period and Trade Payables Collection Period
Trade receivables is a financial metric that indicates the time interval between credit sale and receiving payment from the client. In Tesco’s case, the UK firm had a trade receivable of approximately $1.752 billion as of February 2021. This amount represents the monetary value of products and services sold and rendered to the customers but they have not paid for these commodities and packages (Jiambalvo, 2019). In contrast, trade payable collection period is a financial term used by accountants to evaluate the time interval between acquisition on credit and making payment to the merchant. Akin to other ratios, this metric is considered over a period of time and compared with other firms in the same industry.
Days Payable as of February 2021
= Average accounts payable
= Accounts Payable ÷ Cost of goods sold × Days in period
((10902.76 + 11649.1)/2) ÷ 37574.202496533 × 365÷2
Tesco’s trade payable collection period = 54.77
Sector Specific Impacts and Comparison with Other Industries
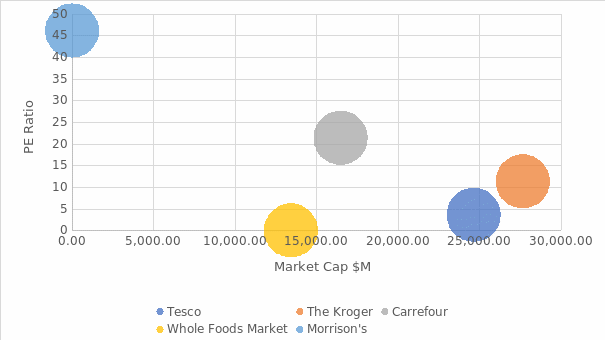
The competitive comparison of Tesco can be conducted with other firms in the same industry with headquarter located in the same nation. The figure below indicates various competitors of Tesco with their relative market capitalization in million United States dollars and PE ratios. As illustrated in the bubble chart, America’s Kroger company outperforms these firms with a market capitalization of $27.680 billion and a PE ratio of 3.59.

Limitations Associated with the Ratios
Utilizing liquidity ratios to analyze Tesco’s financial capabilities may be limited. For example, using liquidity metric on an impartial basis is not adequate to examine the liquidity position of an organization as it depends on the amount of current assets rather than the quality of the resources. Moreover, current ratio incorporates inventories in the computation, which may lead to overvaluation of the liquidity capability in several cases (Brigham & Houston, 2021). In addition, companies that have seasonal sales may record have fluctuations in their current ratios. Lastly, liquidity ratios may be affected by the variation in inventory valuation system by the corporation.
Profitability ratios are generally important in assessing the financial position of a firm. However, these metrics have several limitations since they are reliant on numerous calculations. As such, an error or fraud in the steps of estimation may be detrimental for investors and organizations in the future. Ratios may also be consistent due to the probability factor and hence, they should not be adhered to religiously (Davis & Davis, 2019). Moreover, the value of investment and income can simply be changed to reduce the profitability metrics as per individual requirements which may be deceptive for shareholders.
Investment ratios may have various weaknesses which might impact the company’s investors and stakeholders. For example, the P/E ratio may mislead shareholders especially in regard to its growth prospects. Moreover, this metric is sometimes challenging to use especially when making comparisons across industries. Efficiency ratios may also be significant for businesses but they have their shortcomings such as impacts of inflation which may lead to misrepresentation of data.
Risks and Opportunities Facing Tesco
Tesco’s external environment presents various opportunities that will enable it to improve its performance. For example, the monumental transformations leading to the growth of online grocery sales following the advent of the coronavirus pandemic has allowed customers to purchase more groceries without having to visit brick-and-mortar stores. Moreover, the emergence of meat alternatives following an elevated global demand for plant-base sources of proteins is a factor favoring the growth of Tesco. However, the company has various risks that threaten its long-term strategic existence. For example, the economic consequences of Brexits have affected approximately 80% of imported foodstuff sold in grocery stores (Guo & Wang, 2019). Moreover, economic recession accompanied by increased competition in the retail sector pose as long-standing risks for Tesco.
The UK firm has incorporated various plans to address its threats. For example, investing resources to improve its online space will help it manage various risks associated with the challenges of the coronavirus pandemic. The company can also consider improving its differentiation and other competitive strategies to overcome the threat posed by aggressive rivalry in the retail segment. In essence, Tesco should enhance its management approaches to address the challenges presented in its external environment.
Recommendations
Following the financial analysis using various ratios, there are several suggestions that can help an investor to make feasible and lucrative decisions for a potential investment in Tesco. Since Tesco has a quick ratio of 0.80, it indicates that it does not have enough liquid assets to cover its debt obligations. In addition, Tesco’s profitability ratios suggest that it is a practical investment option for shareholders since its annual net profits have been increasing. Its dividend yield is approximately 1.20 implying that it is in a good financial position to fund payout without relying on external financiers.
Conclusion
This paper has analyzed the financial position of UK’s leading firm, Tesco, from the stance of a potential investor and proposed various ways in which shareholders can benefit. Tesco is a multinational company operating in the United Kingdom managing multiple groceries and general merchandise. Currently, the company has several opportunities such as increased online sales, development of e-commerce, and the emergence of meat alternatives whereas its external environment has brought various threats such as global recession and detrimental effects of Brexit.
References
Appelbaum, D., Kogan, A., Vasarhelyi, M., & Yan, Z. (2017). Impact of business analytics and enterprise systems on managerial accounting. International Journal of Accounting Information Systems, 25, 29–44. Web.
Brigham, E. F., & Houston, J. F. (2021). Fundamentals of financial management. Cengage Learning.
Cokins, G. (2017). Strategic business management: From planning to performance. John Wiley & Sons.
Davis, C. E., & Davis, E. (2019). Managerial accounting. John Wiley & Sons.
Guo, L., & Wang, Z. (2019). Ratio analysis of J Sainsbury plc financial performance between 2015 and 2018 in comparison with Tesco and Morrisons. American Journal of Industrial and Business Management, 9(2), 325–341. Web.
Jiambalvo, J. (2019). Managerial accounting. John Wiley & Sons.
Rosnizam, M. R. A. B., Kee, D. M. H., Akhir, M. E. H. B. M., Shahqira, M., Yusoff, M. A. H. B. M., Budiman, R. S., & Alajmi, A. M. (2020). Market Opportunities and Challenges: A Case Study of Tesco. Journal of the Community Development in Asia, 3(2), 18–27.
Shapiro, A. C., & Hanouna, P. (2019). Multinational financial management. John Wiley & Sons.
Weygandt, J. J., Kimmel, P. D., & Kieso, D. E. (2018). Financial and managerial accounting. John Wiley & Sons.
Weygandt, J. J., Kimmel, P. D., Kieso, D. E., & Aly, I. M. (2018). Managerial Accounting: Tools for Business Decision-making. John Wiley & Sons.