Introduction
Textile Company A is a small business in North Carolina that is currently struggling due to the changing global environment. The organization is engaged in the purchase of textiles in Europe, the Middle and Far East, as well as their distribution in the United States. The complication of global supply chains leads to a constant increase in the cost of purchasing textiles, which negatively affects the company’s profits. To overcome this crisis, Textile Company A plans to expand its operations to South America and Canada. In this regard, the company needs to upgrade its information infrastructure for better data analytics within the company.
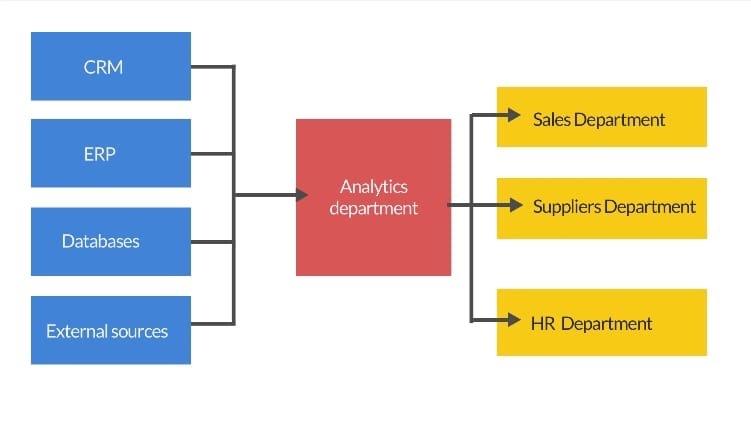
Prior to the implementation of the project to create a business intelligence (BI) system, the organization used an outdated approach to storing and analyzing data. It was minimally automated and did not allow working effectively with a large amount of data. In particular, the company used several separate data sources (CRM, ERP, individual databases, and external sources) and generated individual reports based on the data received from each of them. This approach made holistic data analytics and information-driven decision-making more difficult. A diagram illustrating the old data analytics system at Textile Company A is presented in Figure 1.
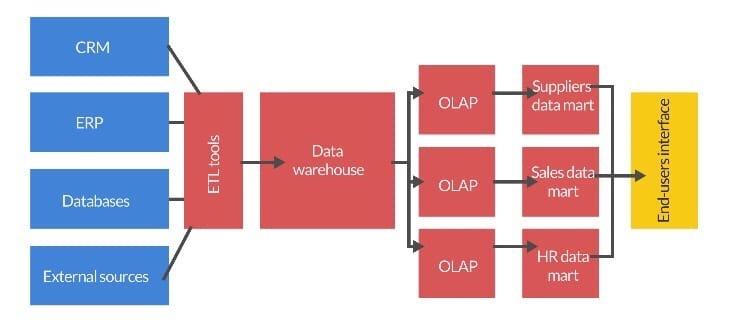
As part of the project, it was possible to create a new BI infrastructure in the organization, which fully automated the company’s interaction with data. It was possible to create a structure consisting of ETL tools (Extract, Transform, Load), a data warehouse, online analytical processing (OLAP), and data marts. A detailed scheme of the BI infrastructure created for Textile Company A is illustrated in Figure 2. As a result, this infrastructure uses all the company’s data sources for analytics and generates the most informative reports for different organization reports. Additionally, BI helps in structuring data and filtering out unnecessary information. Textile Company A can now use the framework for descriptive and predictive analytics. This allows the company to streamline existing processes and make better decisions for future expansion planning.
The project started with an evaluation of the data analytics structure that existed in the company. After assessing the available resources and the needs of the organization, decisions were made regarding suitable storage solutions as well as BI tools. Further, the BI infrastructure was planned, and the steps for its implementation into the existing information structure of the company took into account all the necessary changes. After that, BI was implemented and integrated into the analytics structure of Textile Company A. At the last stage, tests were carried out to evaluate performance, and employees were trained to work with the end-user interface.
Review of Other Work
The materials considered in the project proposal made it possible to effectively plan the development and implementation of the BI solution. However, during the implementation of the project, additional research was required to identify points for improving the existing design. The paper by Dieni et al. (2021) describes the process of creating a BI infrastructure for unemployment rate analysis and management for the Central Bureau of Statistics of Indonesia. Although this article does not belong to the scope of SMEs, it provides a detailed description of all stages of the process of developing and implementing a BI infrastructure. Dieni et al. (2021) pay great attention to the development stage of the ETL tool, which, as emphasized, is the most significant for the correct operation of the BI structure. Based on the analysis presented in the article, it was decided to use the Pentaho BI solution as the main ETL tool, as well as a resource for the cloud data warehouse. This approach can both reduce the cost of creating a BI infrastructure and provide a company with additional options for the future expansion of an information-analytical system.
During the implementation of the project, the possible use of alternative solutions to create the most balanced infrastructure was also considered. At the planning stage, it was decided to use a hybrid approach to the data warehouse: both cloud-based and physical storage. Garani et al. (2019) analyzed the case of implementing the BI solution in a telecommunication company. They focus on the design of a data warehouse that would be effective for all the business tasks required by the organization. As part of the research, Garani et al. (2019) propose the scheme of the data warehouse containing five dimensions of data sets divided into different categories (customers, calls, contracts, employment, and product). Most importantly, they explain how each of those data sets is related to OLAP structures, which are used in the current project as well. This study showed how to structure a data warehouse information system in the most efficient way in order for it to work best with data OLAP. Additionally, the article confirmed the need to use cloud-based storage for interaction with OLAP in conjunction with a physical warehouse.
On the whole, OLAP and data warehouse design and implementation are the most challenging parts of the project. At the stage of developing these parts of the infrastructure, many questions arose regarding how best to organize these elements relative to each other. Al-Aqrabi et al. (2019) present a case study on the integration of OLAP into the BI infrastructure. Most valuable is that in this article, the researchers offer a detailed description of the OLAP framework and describe the elements that interact most effectively with various types of data warehouse solutions. The use of cloud-based BI data storage when integrating OLAP requires “compliance of the BI application with web services architectural standards (and the standards defined by the SaaS or PaaS provider, like Google Apps standards)” (Al-Aqrabi et al., 2019, p. 81). This information is extremely important for the implementation of the project, as it allows you to take into account the compatibility of infrastructure elements.
Thus, the literature reviewed in the project proposal helped in the analysis and evaluation of the existing analytical structure of the company, as well as in the selection and design of a relevant BI system. However, during the implementation of the project, it was necessary to optimize the design of the infrastructure in the most efficient way so that it meets the needs of the company and uses a limited amount of resources. The materials considered during the implementation and described in this section made it possible to take into account the subtleties of the design of BI infrastructures that were not obvious during preliminary planning. The study of these sources will help create the most effective structure and avoid possible difficulties with its operation.
Changes to the Project Environment
Before the implementation of the project, the analytical infrastructure of Textile Company A was extremely outdated and required an upgrade in accordance with modern technical standards. The company used manual data analysis of the companies listed in the databases, which was carried out by the analytical department. After that, based on the analytics, reports were compiled for the company as a whole without taking into account the needs of individual departments. This structure was slow and inflexible and could also contain a large number of errors and irrelevant information. This situation made it impossible to effectively optimize the company’s operations, as well as plan for expansion.
The BI infrastructure implementation project has significantly changed the company’s decision-making process based on the received analytical data. Most importantly, data analytics has become as automated as possible, which has increased the efficiency of using the information in the company at times. In particular, the ETL tool made it possible to filter out irrelevant data, which minimized the number of errors. The inclusion of March data in the BI infrastructure has allowed departments to receive personalized analytical reports based on their needs. Additionally, the use of OPLA cubes has made the structure extremely stable in the event of a future increase in the number of databases and an increase in the number of queries.
Overall, the implementation of the BI infrastructure has allowed Textile Company A to use descriptive analytics to optimize its operations and predictive analytics to plan the company’s expansion. It is also important that employees of various departments have access to multidimensional information for better decision-making. Data analytics in the company has become efficient, eliminating errors and providing the most relevant and important information. This system can become the basis for the future development of the company and a significant increase in its performance.
Methodology
ADDIE methodology model was chosen for the project execution as it presents the most appropriate approach. This model includes five crucial steps: analysis, design, development, implementation, and evaluation. The main advantage of this structure is the sequence of steps and flexibility in the implementation of the project. In particular, ADDIE involves evaluation after each of the major stages of project execution, which allows you to adjust its development depending on the emerging conditions.
The analysis stage includes goal-setting and the resources available for the project. This step also identifies the problem the business has and offers a set of potential solutions that could address it. At the design stage, the specific tools that will be used within the project are determined, deliverables are developed, as well as project evaluation criteria. Those two steps have already been completed under this proposal and are described in the project overview sections, which contain a description of the problem and the relevant IT solution.
The development stage started with the assignment of the analytical team, which will work with ready-made BI. This step also includes the choice of the warehouse, the analytical architecture of the system, and the end-user interface, as well as setting data integration tools. The implementation of the project will include the creation of a fully functional BI structure for Textile Company A and the completion of the onboarding of the analytical team. The final stage of the project is evaluation, which requires tests to create informational reports for various departments.
Project Goals and Objectives
Goal 1
BI infrastructure features assessment and planning. At this stage, it is necessary to evaluate the existing resources, infrastructure, goals, and responsible persons, as well as a potential vendor for the implementation of BI. This goal has been met when all key aspects of the BI solution are selected and clearly defined based on available data and based on the objectives of the organization. This goal included two objectives:
Objective a
BI implementation strategy development. This objective includes activities to evaluate the company’s current resources and infrastructures and appropriate changes that have to be made in order to achieve the company’s goals. The objective was considered successful when all the decisions regarding BI infrastructure design were made, including the choice of relevant and available tools.
Objective b
Defining key BI characteristics. This objective allows the project to scale the required BI structure and exclude features that the company does not need. At this stage, it is important to assess the competencies available to the organization, as well as the KPIs that are key to monitoring. The objective was considered successful when the complete diagram of the BI infrastructure was created.
Goal 2
BI infrastructure design and implementation. This goal is key within the framework of this project, as it involves the creation of a functioning BI infrastructure as a result. This objective is supported by three objectives, which include setting data integration tools, BI architecture design, and end-user interface implementation. These objectives describe the key aspects of the software architecture BI solution and constitute a fully functional structure.
Objective a
Setting data integration tools. For the correct operation of BI, tools for collecting, processing, and storing data are required, which requires the choice of data warehouse and data integration tools. At the moment, cloud data storages are the most common, which is especially important for SMEs. The objective was considered successful when the data integration tool was installed and connected to the company’s databases.
Objective b
Choosing an approach for architecture design. At this stage, it is necessary to decide, based on the needs and resources of the company, which BI architecture is the most relevant. In this situation, the company plans to expand, so it would be logical to use a hybrid setup (warehouse + OLAP + data marts) to increase the potential duration of the BI solution. The objective was considered successful when the data warehouse, OLAPs, and data marts were installed and connected to the ETL tool.
Objective c
The end-user interface implementation. At this stage, it is important to choose a tool that will allow the company to effectively represent the collected data in the form of analytical reports for employees. The objective was considered successful when the end-user interface was installed and connected to the BI structure.
Project Timeline
The main stages of the project implementation took place according to the schedule, as the project team worked well-coordinated and according to a well-thought-out preliminary plan. However, the delay occurred during the BI infrastructure setting phase, which was scheduled to be completed in 10 days. Instead, the process took 12 days, as there were difficulties connecting the company’s databases to the ETL tool, which required additional research and planning. Difficulties arose due to the incompatibility of existing databases with the selected ETL tool. After reviewing the materials described in the review of the work section, it was decided to switch to Pentaho ETL solution, which required additional settings. Thus, the project implementation ended on 10.22.2024 instead of 10.20.2024 with a delay of less than 2 days.
Unanticipated Requirements
An unanticipated requirement that arose during the implementation of the project was the need to choose a more relevant ETL tool. The problem arose during setting up the BI infrastructure and testing its operation. Initially, it was planned to use the Apache Spark tool as an ETL since it is free and easy to implement. However, later it was discovered that this Apache Spark does not correctly interact with various file formats, including PDF, which are widely used in company databases. This problem led to incorrect data filtering, which drastically reduced the effectiveness of the tool. Thus, it was decided to choose a more suitable instrument, which resulted in the need for additional research and a slight delay. As a result, it was decided to use Pentaho because this structure is able to work with a variety of files, and it is also widely considered in the literature and is popular in case studies. The main reason for choosing this solution was the widespread use of Pentaho among SMEs, which is most relevant for this project.
Conclusions
The main result of the project implementation is the creation of a fully functional BI infrastructure in Textile Company A. The potential effect of the project is the ability to effectively use descriptive and predictive analytics in the organization to optimize current operations and plan for expansion. Among the immediately observed effects, one can single out the complete automation of the process of storing, analyzing data, and generating information reports. Most importantly, the ETL tool integrated into the infrastructure allows the company to minimize the amount of irrelevant information through the sorting of data in the databases used. The project is considered successful because, as a result of the implementation of the BI infrastructure, it became possible to generate multidimensional informational reports that various departments of the company can use for a more efficient decision-making process.
Project Deliverables
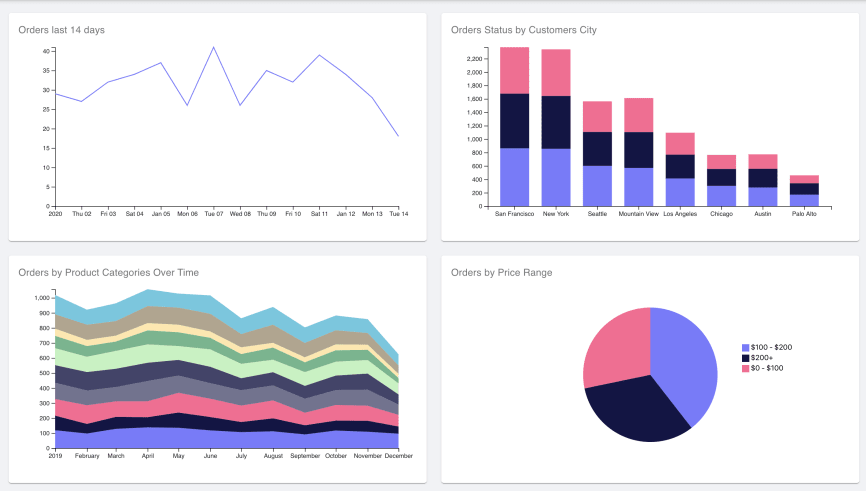
Figure 1 shows a diagram of the data analytics structure that existed at Textile Company A before the project was implemented. Previously, the company used manual data analysis and the generation of information reports, which were handled by employees of the analytical department, which resulted in low efficiency of data analysis. Figure 2 illustrates the BI infrastructure diagram that was created at Textile Company A as part of the project implementation. This scheme describes all the key elements of the system and their interaction. Based on this illustration, it can be judged that the project made it possible to automate the process of data analytics in the company in order to increase the efficiency of the decision-making process based on reports. Finally, Figure 3 contains an example of a multidimensional report that is generated by the BI infrastructure created within the project. This illustration is the most important deliverable of the project, as it shows the actual result of its implementation.
References
Al-Aqrabi, H., Liu, L., Hill, R., & Antonopoulos. (2019). Cloud BI: Future of business intelligence in cloud. Journal of Computer System Sciences, 81(1), 85-96.
Dieni, T. O., Tania, K. D., Fathoni, M., Jambak, I., & Putra, P. (2021). Business Intelligence for unemployment rate management system. International Journal of Informatics and Computer Science, 5(2), 111-117.
Garani, G., Chernov, A. V., Savvas, I. K., & Butakova, M. A. (2019). A data warehouse approach for business intelligence. 2019 IEEE 28th International Conference on Enabling Technologies: Infrastructure for Collaborative Enterprises (WETICE), 70-75.