Introduction
Unilever Plc is a multinational conglomerate founded in 1883 in the United Kingdom (UK). The company has its headquarters in London; it has grown its product portfolio from the founding sunlight soap brand and now boasts over 400 different product brands. Its operations span 190 countries globally, providing a broad customer base that drives the company’s purpose of making “sustainable living commonplace” (Unilever, 2021). This report captures a financial analysis of Unilever that focuses on examining the company’s decisions relating to strategic investment. The first part of the report entails the evaluation of the company’s capital structure, including the business risks. The second part captures an assessment of Unilever Plc’s financial performance covering the five-year summary and financial ratio analysis compared to Nestle’s peer company. The third part provides recommendations for improving Unilever Plc’s capital structure and financial performance, followed by a conclusion. Unilever’s long-standing existence affords it the capacity to have a healthy financial performance to help it achieve its purpose.
Evaluation of Unilever Plc’s Capital Structure
A company’s capital structure constitutes the composition of debt and equity utilized to fund business operations, including acquiring capital items. According to Unilever (2021), the company’s capital structure constitutes over 30 billion euros in debt capital. The share capital amounts to a meager 92 million euros, far below the share of debt owed by the company. Unilever is a renowned company that has established itself primarily by leveraging the balance sheet to access the debt and equity markets. The company continues to grow through acquisitions, thereby inheriting the debt the acquired entities sustained, which is mainly made up of debt. It has an admirable long-term and short-term credit rating of A+ and A-1 according to standards and poor, while Moody’s ratings are A-1 and P-1, respectively. Both credit rating organizations provide a stable outlook for the company. Based on the favorable rating, the company finds it easy to borrow more from the public and financial institutions (Collier, 2015; Dyson and Franklin, 2020). Hence the higher component of bonds in the capital structure.
The capital structure manifests Unilever’s preference for debt capital over equity. The tendency is supported by the appetite for companies to borrow more from the global bond market (Attaoui and Poncet, 2013; Higgs, 2019). Second, Unilever has access to bank loans provided through an overdraft facility. On 31 December 2021, Unilever had over €27.6 billion in bonds and over €402 million in commercial loans (bank loans and overdrafts). Third, the company leverages financial derivatives, including foreign exchange contracts and interest rate swaps amounting to over €3.5 billion, supporting risk mitigation. In total, Unilever (2021) shows that the company had over €51.5 billion in debt as of 31 December 2021, while the total company shareholding equity value stood at over €6 billion. The figures provide an unapparelled desire for Unilever to take more debt capital than equity.
The company’s resolve to acquire more debt capital supports its drive for sustainability. Unilever has, over its existence, developed a business model that enables it to deliver higher performance. The company seeks to steadily report financial outcomes that rank it within the top tier of the companies in the industry. On this basis, the company would seem to prefer acquiring cheaper sources of capital in the form of debt. According to Dewaelheyns and Van Hulle (2008), debt capital is considered a more affordable source of funds than equity even though it has finite-to-maturity terms that lawfully bind the company to pay fixed cash outflows. Attaoui and Poncet (2013) state that debt provides an easy window for a company to refinance its operations at some prospective time, albeit at an unspecified cost. On the other hand, Shamshur (2010) argues that equity is a more expensive source of capital even though it is permanent and has greater financial flexibility.
The company risks being exposed to financial distress by acquiring more debt capital. High gearing should accompany solid financial performance, especially the ability to generate profits. Berk et al. (2019) argue that by generating more profits, a company can be able to pay for the borrowed funds. If the number of profits generated is too low, the company risks defaulting on payments, which could be declared insolvent. Unilever has spread so broadly, and billions of people use their products every day. If it falls, it will have a significant impact on the creditors and the consumers and distributors who depend on its existence to satisfy their daily demands.
The principal business risk faced by the company in 2021 pertains to the disruption in the supply chain and the strong emergence of e-commerce as an effect of COVID-19. According to Varghese and Haque (2021), the pandemic destabilized the customary economic order, so governments had to intervene through extraordinary fiscal and monetary measures. In the course of recovery, businesses began to jostle for the scarce raw materials leading to exceptionally high levels of cost inflation. The business environment risked the company’s profitability by spending more to navigate the constrained supply chains and reduced availability of labor and vital raw materials, especially soybean oil and palm oil, from the source markets.
The same risk was manifest in Nestle and Procter & Gamble (PG), which deal in consumer goods production. Fu and Smith (2021) state that the elasticity of price changes in consumer goods would further expose the companies to lose revenue due to reduced spending power. The lockdowns provided an excellent opportunity for the companies to risk investing in e-commerce due to the probability of failing to deliver ordered items. The companies improved on the prior investments in e-commerce and earned more returns as online deliveries increased significantly across different key markets. The gains realized from the investment in the online platform helped in enhancing the overall sales turnover.
Assessment of Unilever Plc’s Financial Performance
A company’s financial performance indicates its business’s healthiness in sustaining operations and catering to the needs of interested parties. Madura and Hoque (2018) state that no company can singularly succeed in attaining its purpose. For Unilever to make sustainable living commonplace, it has to work closely with other players, including shareholders, customers, suppliers, lenders, competitors, employees and their representatives, investment analysts, and the government.
Five-Year Summary of Financial Performance
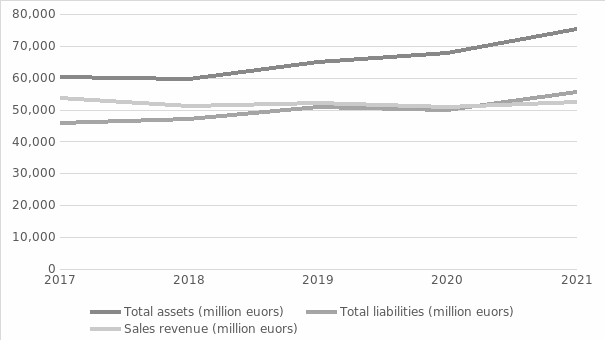
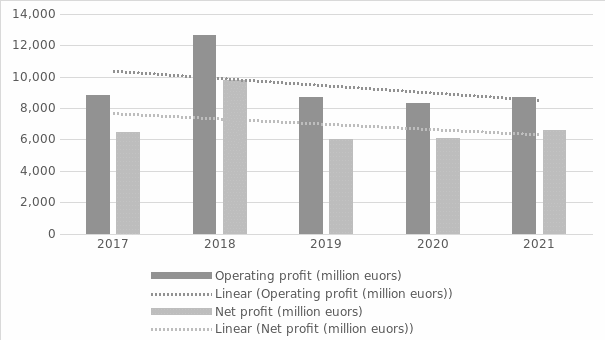
The different stakeholders have varying interests in a company, but financial performance is critical. In the past five years, Unilever has realized a steady growth in total assets and liabilities, as depicted in figure 1 below. However, the sales revenue has remained relatively stable over the same duration. Figure 2 reveals that Unilever has experienced an overall decline in profitability. Operating profit and net profit were highest in 2018 at 12.6 billion euros and 9.8 billion euros, respectively (Unilever, 2021). In 2019, the company’s profitability plummeted due to the effects of COVID-19. As a result, the company spent more on supporting outlay in measures to help mitigate the impact of the pandemic on the company, including the workforce. As of 2019, the company’s profitability has been on an upward surge as the global economy recovers from the devastation of the disease.
Financial Ratio Analysis
Apart from the overall financial performance trend, stakeholders are interested in having a deeper understanding of the results. McLaney and Atrill (2020) state that stakeholders seek to understand different aspects of the company’s performance through financial analysis. The evaluation is mainly enabled through the use of financial ratios that are easy to interpret. In this case, the financial analysis of Unilever is evaluated alongside Nestle, a Swiss multinational corporation operating in the same industry. The financial analysis focuses on five key areas: profitability, efficiency, liquidity, gearing, and investment ratios.
Profitability
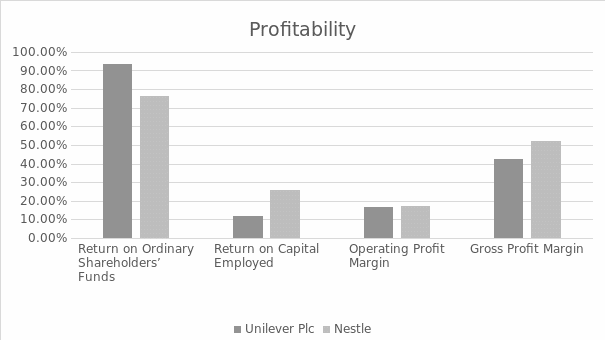
All stakeholders have a keen interest in the company’s profitability. It indicates an entity’s capacity to acquire additional capital to finance its activities and expand to new markets (Melicher and Norton, 2016; Miglo, 2020). Appendix 1 provides a table and figure containing the profitability ratios considered in this report. The results indicate that Unilever outperformed Nestle regarding the return on ordinary shareholders’ funds, which suggests that the company provided a better return to shareholder investment at 93.5% and 76.1% percent, respectively. On the other hand, Nestle posted better profitability on the return on capital employed, operating margin, and gross margin at 25.6%, 17.4%, and 52%, respectively.
Efficiency
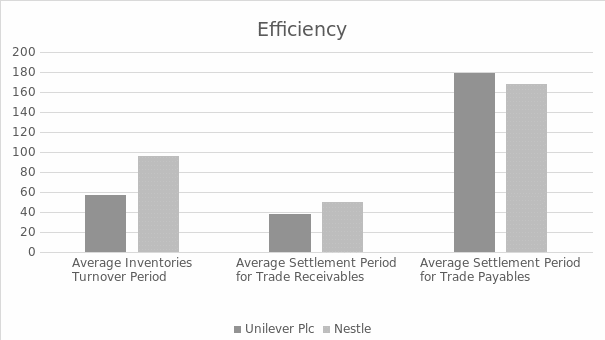
The effectiveness with which a company utilizes and manages its resources would attract the attention of the stakeholders. Efficiency ratios indicate how well the assets and capital are used to produce more sales revenue (Revsine, 2020; Needle, 2015). The results in Appendix 2 indicate that Unilever can efficiently use its resources to generate better returns. The results suggest that the company has better efficiency on the average inventories turnover period, average settlement period for trade receivables, and average settlement period for trade payables. In addition, the company has a favorable sales revenue to capital employed ratio, sales revenue per employee, and return on capital employed than Nestle.
Liquidity
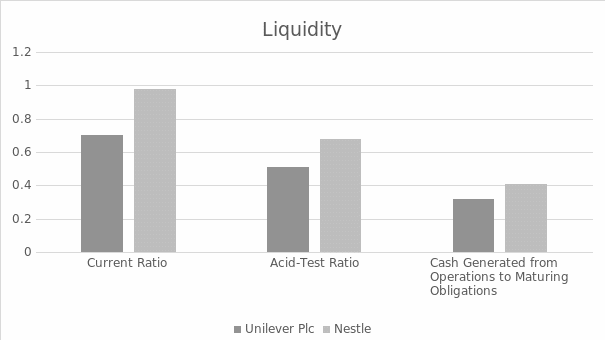
A company’s liquidity defines the capacity of the entity to pay for its short-term obligations based on the availability of liquid assets. According to Atril and McLaney (2019), the standard liquidity measures are the current and the acid-test ratios, with the preferred margin expected to be 2:1 and 1:1, respectively. Judging by that standard, both Unilever and Nestle had poor liquidity in 2021. However, Nestle posted slightly better liquidity with a current ratio, acid-test ratio, and cash generated from operations to maturing obligations of 0.98, 0.68, and 0.41, respectively, as depicted in Appendix 3.
Gearing
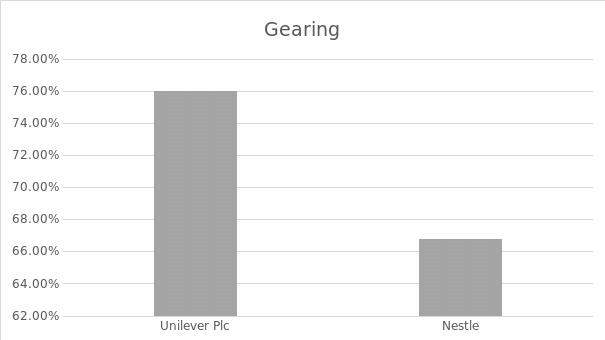
The gearing ratio evaluates the financial risk in a company’s capital composition. A higher gearing ratio indicates more significant financial distress because of more debt (Shivdasani and Zenner, 2005; Morrison, 2017). The results in Appendix 4 indicate that Unilever had a higher gearing ratio than Nestle at 76% and 66.8%, respectively. However, the interest cover ratio shows the company can generate operating profits that can be used to settle the debt much better than Nestle at 17.4 times and 12.3 times, respectively.
Investment
Finally, stakeholders desire to evaluate a company’s investment viability. According to Reyers (2019), ratios help investors make healthy investment decisions. The results in Appendix 5 show that Unilever ranks better in paying dividends with a dividend payout ratio and dividend yield ratio of 74.1% and 3.8%, respectively. On the other hand, Nestle posts more robust performance in rewarding shareholders with an earnings per share and price/earnings ratio of 5.82 and 26.4, respectively. For Unilever, the earnings per share and price/earnings ratio in 2021 were 2.33 and 19.5, respectively.
Recommendations for Improvement of Unilever Plc’s Capital Structure and Financial Performance
Unilever Plc’s capital structure is characterized by a considerably high gearing ratio, posing a threat to the business. According to Asai (2021), gearing comprises debt and equity; therefore, the company can only manage it by increasing or reducing either source of finance. Since Unilever has a higher gearing of more than 50%, the debt capital is exceedingly high. The predicament can principally be addressed by increasing the share capital. The company may opt to sell more shares to the public, and the funds collected can be committed to pay out and reduce the debt capital. Alternatively, Blecke and Gotthilf (2019) state that the company can negotiate with the financiers to convert its debt into equity, effectively balancing the gearing ratio.
Still, the management can find alternatives to dropping the outflow of funds by reducing operation inefficiencies. In addition, the company can create operational strategies to generate additional revenues and profits, and the funds are committed to paying off and reducing the debt component. Wilson (2018) argues that enhanced profitability will attract more investors in the stock market that will see the company’s share price trade at a higher price. The company will experience increased market capitalization, which will translate to higher wealth creation for investors.
Business survival and growth depend heavily on effective financial management. Once the share of debt capital is reduced, the company can reduce the financial costs committed to making loan repayments plus the interest expense. In effect, the senior executives at Unilever will be able to enhance financial decision-making in several ways, especially in planning, controlling, organizing, and monitoring finances (Bamber and Parry, 2021; Boddy, 2016). First, the company will have greater disposal of funds generated through profits that can be used to finance arising business opportunities. In addition, Unilever will improve budgeting activities since the funds intended for different undertakings will be readily available. According to Alexander (2017), financial decision-making can be enhanced through better preparation for the future, which will make the company work effectively towards attaining its purpose and goals. Lastly, it will be easy for the company to tackle business challenges as soon as they arise. Heavy reliance on debt presents a stressful financial position for the company. The company’s management may not have more freedom to make financial decisions that may sound risky to creditors keen on being paid back their funds.
Conclusion
In general, Unilever heavily depended on debt capital for financing. It generated profits during the year, but the profitability was below Nestle, a close competitor. However, Unilever posted greater efficiency in utilizing and managing its resources. Besides, both Unilever and Nestle had suppressed liquidity and high gearing, but they managed to pay dividends and returns to shareholders. It is recommended that the company reduces debt capital. The move will see the company make savings that it can use to enhance its business operations. The management will have space to make financial decisions without being constantly watched by the creditors.
Reference List
Alexander, D. (2017). International financial reporting and analysis. Andover, Hampshire Cengage Learning.
Asai, K. (2021). Corporate finance and capital structure: A theoretical introduction. Routledge
Attaoui, S. & Poncet, P. (2013). ‘Capital Structure and Debt Priority’. Financial Management, 42(4), pp.737–775. doi:10.1111/fima.12011.
Atril, P. & McLaney, E. (2019). Accounting and finance for non-specialists, Eleventh Edition, Pearson, London.
Baker, H.K. & Martin, G.S. (2011). Capital structure and corporate financing decisions: Theory, evidence, and practice. Hoboken, N.J.: Wiley.
Bamber, M. & Parry, S. (2021). Accounting and finance for managers: A business decision making approach, 3rd Edition, KoganPage, London, UK.
Berk, J., DeMarzo, P. & Harford, J. (2019). Fundamentals of corporate finance, 4th Edition, Pearson, London.
Blecke, C. J, & Gotthilf, D. L, (2019). Financial analysis for decision making. 4th ed. Englewood Cliffs, N.J, Prentice-Hall.
Boddy, D. (2016), Management: An Introduction, (7th edition), Pearson Press.
Collier, P.M. (2015). Accounting for managers: Interpreting accounting information for decision-making, John Wiley & Sons, Chichester, United Kingdom.
Dewaelheyns, N. & Van Hulle, C. (2008). ‘Internal capital markets and capital structure: Bank versus internal debt’. European Financial Management, 16(3), pp.345–373. doi:10.1111/j.1468-036x.2008.00457.x.
Dyson, J.R. & Franklin, E. (2020). Accounting for non-accounting students, 10 Edition, Pearson, London.
Fu, F. & Smith, C.W. (2021). ‘Strategic financial management: Lessons from seasoned equity offerings’, Journal of Applied Corporate Finance, 33: pp. 22-35.
Graham, J. & Harvey, C. (2002). ‘How do CFOs make capital budgeting and capital structure decisions’, Journal of Applied Corporate Finance, 15(1), pp. 8-23.
Higgins, R.C. (2019). Analysis for financial management. New York, Ny: Mcgraw-Hill/Irwin.
Madura, J. and Hoque, A. (2018). International financial management. South Melbourne, Australia: Cengage Learning Australia.
Maclean, L.C. and Ziemba, W.T. (2019). Handbook of the fundamentals of financial decision making. Singapore; Hackensack, Nj: World Scientific Publishing Co. Pte. Ltd.
McLaney, E. & Atrill, P. (2020). Accounting and finance: An introduction, 10th Edition, Pearson, London.
Melicher, R.W. and Norton, E.A. (2016). Introduction to finance: Markets, investments, and financial management. 16th ed. Wiley Publishers
Miglo, A. (2020). A new capital structure theory: The four-factor model. Wiley Publishers.
Morrison, J. (2017). The Global Business Environment, (4th edition), Palgrave.
Needle, D. (2015). Business in Context: An Introduction to Business and Its Environment, (6th edition), Cengage Learning.
Nestle, (2021). Nestle annual report. Web.
Reyers, M. (2019). ‘The role of financial literacy and advice in financial decision making’, Southern African Business Review, 20(1), pp.388–413. doi:10.25159/1998-8125/6057.
Revsine, L. (2020). Financial reporting & analysis. New York, Ny: Mcgraw-Hill Education.
Ruben, J. (2021). ‘A practitioners’ guide to leverage through downturns’, Journal of Applied Corporate Finance, 33, pp. 111-120.
Shamshur, A. (2010). ‘Access to capital and capital structure of the firm’, SSRN Electronic Journal. doi:10.2139/ssrn.1721455.
Shivdasani, A. & Zenner, M. (2005). ‘How to choose a capital structure: Navigating the debt-equity decision’, Journal of Applied Corporate Finance, 17(1), pp. 26-35.
Subramanyam, K.R. (2014). Financial statement analysis. New York, Ny: Mcgraw-Hill.
Unilever, (2021). Unilever annual report. Web.
Varghese, R. and Haque, S. (2021). ‘The COVID-19 impact on corporate leverage and financial fragility’, IMF Working Papers, 2021(265), p.1. doi:10.5089/9781589064126.001.
Wilson, C. (2018). Financial management. South Melbourne, Victoria: Cengage Learning Australia.
Appendices
Appendix 1 – Profitability Ratios
Appendix 2 – Efficiency Ratios
Appendix 3 – Liquidity Ratios
Appendix 4 – Gearing Ratios
