Introduction
The Trans-Pacific Partnership (TPP) was central to President Obama’s strategic pivot to Asia. The trade agreement was signed by twelve Pacific Rim countries, including the United States, which together covered almost 40 percent of the world’s economy. The TPP generated a great deal of controversy: while its proponents predicted US trade expansion and investment overseas, the opponents were wary of a potential decline in manufacturing and lower wages. Soon after coming into office, President Trump issued a letter announcing that the US was withdrawing from the agreement. The letter named the country’s commitment to free and fair trade as the main reason and expressed hope for future discussions on “more efficient markets and higher levels of economic growth.” The remaining eleven TPP countries forged ahead with a new version of the pact, though leaving a spot for the US if it ever decides on returning. This paper analyzes the economic impact of the US withdrawal from the TPP.
Background
Though the effects of the US withdrawal from the TPP have yet to be fully gauged, there has already emerged an extensive body of literature seeking to evaluate the consequences. According to Malik, the US withdrawal from the TPP shifts its role in the global economic arena and empowers China, which Trump wanted to prevent in the first place (22). Between 2000 and 2015, China had capitalized on free trade, openness, and globalization, which increased trade with the Asia-Pacific region while America’s trade decreased in the same period (Malik 27). The TPP was the US’ chance to exert influence over China that had long been rising to prominence as a global superpower. However, now that the US left the agreement, the remaining TPP countries are now inclined toward China for a partnership. In addition, Malik opines that the US longstanding trade partners lost trust in the US (25). These facts suggest the great difficulty that the US would face if it ever decided to rejoin the TPP.
Chepelyev et al. argue that reversing the post-World War II consensus on alleviating trade barriers was one of the hallmarks of Trump’s presidency. As the Trump administration was moving toward a more protectionist and even mercantilist strategy, it left the TPP and raised tariffs on certain kinds of goods. Chepelyev et al. estimate that the decision reduced US agricultural and food exports by $1.4 billion. The remaining TPP members are incentivized to increase trade between each other, which renders imports from the US unnecessary. However, as per the estimates by Chepelyev et al., if the US rejoined the partnership, it would benefit its agriculture as exports would rise by around $2.9 billion.
Chow et al. agree with Malik on the tilt in the relationship dynamic between the United States and China (38). Aside from that, Chow et al. are convinced that when making such a drastic decision, the Trump administration ignored some potential harms to its long-term economic interests (43). In their paper, Chow et al. especially emphasize the development of the agricultural sector in the context of TPP (71). As a member of the partnership, the United States was sourcing or transporting 42% and 47% of its agricultural imports and exports respectively from or to other TPP countries. Agricultural goods are generally more protected than industrial goods, and TPP allowed countries to agree on mutually beneficial tariffs.
However, as shown by Petri et al., these were not the only benefits of the partnership (20). The scholars argued that had the TPP stayed intact, it would have added $492 billion to global GDP resulting in an 0.5% increase (0.5%) in the US GDP. The TPP allowed for some variation in trade-weighted average tariffs among TPP members, which created space for substantial trade liberalization. Apart from that, as estimated by Petri et al., the exports between all TPP members were predicted to increase by more than $1 billion by 2030, which is an 11.5% surge (25). At that, the United States would be behind the lion’s share of export growth, with the country’s exports projected to grow by $357 (9%) billion. Agriculture would be among the sectors that would experience the biggest gains, alongside mining, manufacturing, and service sectors.
Economic Analysis
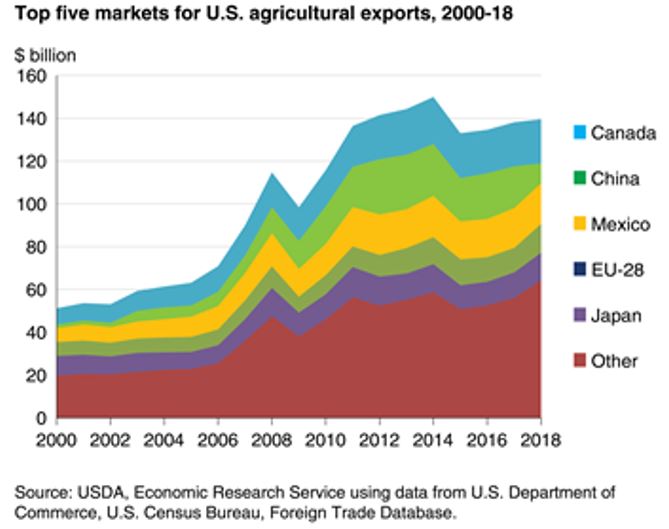
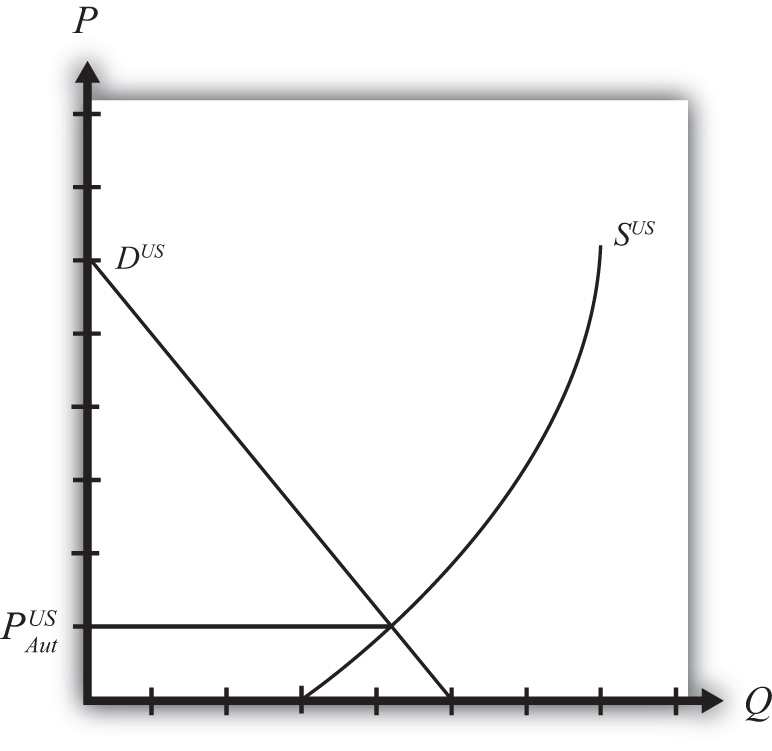
Since the literature review emphasized the effects of the TPP withdrawal on US agriculture, the following economic analysis will also focus on this economic sector. As reported by the United States Department of Agriculture, Canada remained the top export partner of the United States for agricultural goods (see Graph 1). However, as Graph 1 suggests, the export growth stagnated after 2016, around the time when Trump signed the withdrawal. Graph 2 illustrates the supply and demand for agricultural goods in the US market. Demand (D US) and supply curves (S US) intersect at the equilibrium autarky price (P US Aut) that is fairly low.
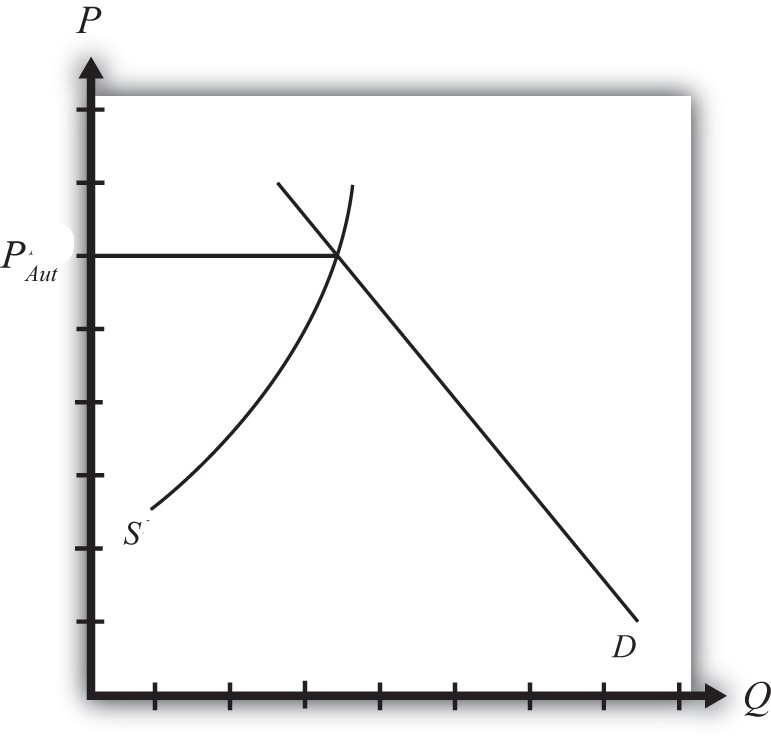
Graph 3 is similar to Graph 3 and depicts the autarky equilibrium in the Canadian agricultural market where prices are significantly higher. It means that when the two countries transition into free trade, the United States exports agricultural goods to Canada. US companies are more incentivized to do so because, in Canada, they will be able to sell their production at higher prices. As the supply of agricultural products in the domestic US market shrinks, Americans have to pay more, which again, adds to the profits made by the sector. The TPP regulates the relationships between US and Canada, making the trade mutually beneficial.
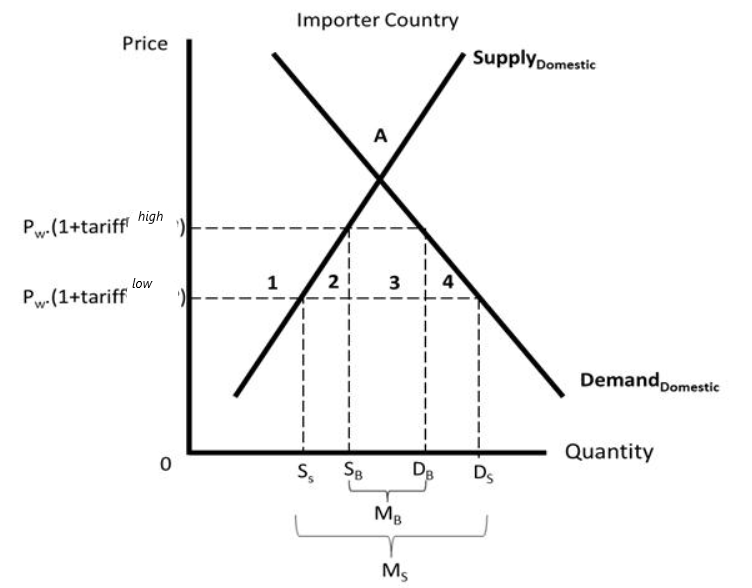
Graph 4 demonstrates what happens to the US agricultural sector after the country’s withdrawal from the TPP. In an attempt to protect domestic production, Trump increases import tariffs, which results in an increase in domestic supply (from SS to SB) and a decline in demand (from DS to DB). Because of that, the price goes from P(1+tariff low) to P(1+tariff high) because supply surpasses demand. As a result, domestic agricultural producers are not able to make as much profit, which is confirmed by recent estimates.
Conclusion
The Trans-Pacific Partnership initiated by President Obama had promising perspectives and showed potential for containing China’s growing leverage. By withdrawing from the agreement, Trump has hurt the country’s interests. As shown in the literature, the agricultural sector was significantly affected with US farmers losing out on export opportunities and experiencing shrinking profits. An increase in importing tariffs shifted the trade equilibrium toward a surplus in domestic supply paired with decreased demand. As a result, prices for agricultural goods within the US domestic market dropped, hurting producers.
References
Chepeliev, Maksym, et al. “Possible Implications for U.S. Agriculture of U.S. Trade Policies: Smoot–Hawley All Over Again?” Choices, Quarter 2, 2019.
Chow, Daniel CK et al. “How the United States Withdrawal from the Trans-Pacific Partnership Benefits China.” The University of Pennsylvania. Journal of Law & Public Affairs, vol. 8, 2018, pp. 37-80.
Malik, Ahmad Rashid. “US Withdrawal from the Trans-Pacific Partnership.” Strategic Studies. vol. 38, no. 1, 2018, pp. 21-33.
Petri, Peter A., and Michael G. Plummer. “The Economic Effects of the Trans-Pacific Partnership: New Estimates.” Peterson Institute for International Economics Working Paper, vol. 16, no. 2, 2016, pp. 1-33.
United States Department of Agriculture. Agricultural Trade. 2018. Web.