Profitability drivers have conventionally been a significant exploration domain in financial statement evaluation field; in reality, profitability analysis can take place through a classic vehicle such as DuPont analysis (Nissim and Penman, 2001). Operational profitability can be investigated by decomposing the ROA (Return on assets) ratio based on DuPont analysis using the two major profitability/efficiency drivers being Asset Turnover (ATO) and Profit Margin (PM) (Nissim and Penman, 2001). Firm’s strategies have a tendency of putting more weight on one of the two drivers (Singh and Agarwal, 2002); in such cases, a business strategy as emphasized by firm’s executives frequently pursues either profitability drivers at the other’s expense. Profit margin is normally associated with the firm’s product differentiation strategy while asset turnover is likely to be linked to cost leadership strategy (Jermias, 2008).
Normally, accounting investigation presumes that companies implement one long-range strategy for many years where companies are either recognized as being product differentiators or cost leaders. The company’s strategy, once initiated through accounting data such as financial statement is then utilized as an analyst of a variety of significant performance variables like executive compensation, financial performance sustainability and debt ratios (Singh and Agarwal, 2002). However, this is an approach that is constructive in obtaining a high-level indication of strategic direction of the company where the strategies’ change of direction is not recognized by the approach. For instance, a company categorized as a leader in cost minimization may steadily turn out to be less efficient as time pass by, joined possibly by profit margin growth strategy (Singh and Agarwal, 2002). The analyst may not be able to identify these moves in strategy by merely using the ratios averages over a period of time. Therefore, such a stationary categorization does not consider a strategy dynamic aspect; that is a strategic direction taken by a firm to build up its profitability or efficiency (Jermias, 2008).
This study introduces an easy, nevertheless more exhaustive financial ratio decomposition approach in the perspective of efficiency or profitability analysis by trying to communicate in a better way the firms’ strategic position within the natural gas and oil production and exploration industry. This paper explores the value of this approach using two firms based in the UK and U.S; each firm’s financial statements are reformulated to differentiate between financing and operating activities. The study then investigates two research questions:
- To what degree are financial ratio trends uniformly dispersed over the study sample?
- Are specific financial ratio trends related to high profitability?
Through the analysis of these study questions, this paper shows how financial ratios can be utilized in advance way when analyzing financial statements. The study is structured as follows. A brief overview on profitability analysis will be presented. Followed by data and method used description. The succeeding part will present the empirical results showing a number of associations between them. Lastly additional research winds up the study.
Theory
Predicting future period efficiency or profitability is the major objective of undertaking analysis of financial statement, mainly because these predictions are normally depended on the evaluation of the company value (Singh and Agarwal, 2002). To make it easy for this analysis, decomposition of revenue or earnings to its drivers is normally advocated. Accounting study that handles financial ratio aims to summarize the data contained in the financial statements of a company into simple and understandable information (Hambrick, 1984). The financial ratios are classified into four major groups such as profitability ratios, investment ratios, liquidity ratios and efficiency ratios (GoldmanSachs.com, 2011).
Profitability ratio measures the management effectiveness as shown by the turnover generated on sales and investment (GoldmanSachs.com, 2011). This means that if a firm can be able to make a profit it will be able to meet its short term obligations and also pay dividends to its owners. The major ratios in this category include: “Net profit margin, Gross profit margin, return on capital employed, operating profit margin, and operating expenses ratio” (GoldmanSachs.com, 2011). Investment ratios are used to calculate the overall performance of the company and are also used to determine the company’s dividend policy, the effect of a proposed financing option on the company and finally to predict the effect of right issue. The investors can use investment ratios to determine the theoretical value of company’s securities and ascertain whether the securities are overvalued or undervalued (Microstrategy.com, 2011)
Liquidity ratios measure the firm’s ability to meet its short term maturity obligations as and when they fall due; they measure liquidity risk of the firm whereby, the lower the liquidity ratio the higher the liquidity risk and vice versa (Meir, 2008).
Efficiency ratios measure the efficiency with which a firm uses its assets to generate turnover. They are also known as activity ratios/ turnover ratios since they indicate the rate at which assets are converted into sales. A balance of sales and the assets reflect that the assets are well managed. These ratios show how efficiently a company has managed its short term asset and long term liabilities (Drake, 2009).
Profit margin is usually determined by Net Income (NI) to Sales or Revenue (RE) based on DuPont analysis, while asset turnover is determined by RE to Total Assets (TA) and their multiple results to ROA. This paper will focus on Penman (2007), who put emphasis on operating assets which are known to generate value to the firm unlike financial assets. He regulates the ROA financial ratio to RNOA (Return on Net Operating Assets), which may be decomposed into ATO and operating Profit Margin (PM) (Penman, 2007). RNOA decomposition, match DuPont analysis of profitability, additionally, RNOA decomposition to ATO and PM has advanced the forecasting value since it is likely to forecast future profitability effectively through the use of PM and ATO variables than merely the single aggregated RNOA ratio (Fairfield and Yohn, 2001). Soliman (2008) found that asset turnover changes may productively forecast future variances in earnings.
Method
Since ATO ratio and PM ratio levels are significantly different in various sectors (GoldmanSachs.com, 2011), a dataset was chosen that include firms from one sector, natural gas and oil production and exploration industry. This sector was partly chosen since one single sector center is in sequence and also because the sector is not widely researched in profitability analysis context. The study data was gathered from the internet sources. A sum of eight large, publicly listed Natural Gas & Oil Production and Exploration Corporations were used for this paper. For example, Afren PLC, ATH Resources PLC, Bisichi Mining PLC and Cove energy PLC all listed in the UK plus US firms such as Apache Corporation, Berry Petroleum Co., Callon Petroleum Co. and Cimarex Petroleum Co. Selection was simple as it was based on a set of miners on the UK and U.S. stock exchanges.
The data collected will be analyzed as follows:

Where ROCE (Return on capital employed) is calculated by adding RNOA to the multiple of Spread and FLEV (financial leverage) while PM is calculated by dividing operating income (IO) with sales (Fairfield and Yohn, 2001). ATO is determined by dividing sales or revenue by net operating income (NOI) whilst spread is equal to ROA minus financing costs (Fairfield and Yohn, 2001).
The following section describes the UK (Afren PLC) and U.S. (Apache Corporation) firms’ background.
Afren PLC: Background
The Afren plc is based in London and is a Natural Gas and Oil Production and Exploration Corporation; this company was formed in the year 2004 with an aim of becoming the leader pan-Africa independent production and exploration organization (Afren.com, 2011). Ever since the initial public offering in the year 2005 in March, the company has steadily grown its portfolio to 16 assets crossways in 7 countries which include Ghana, Gabon, Nigeria, Cote d’Ivoire, Sao Tome $ Principle JDZ, Republic of the Congo and Angola (Afren.com, 2011). The company attained its oil milestone development in late 2000 and ended its acquisition in Coted’lvoire which resulted to over 26,000 total quantity of oil produced in terms of barrels (Afren.com, 2011).
The present firm’s assessment indicates that the company is well placed to carry out additional extension as well as boost shareholders’ value as it was categorized as the top company amongst the listed Exploration and Production firms at the London exchange (Friedemann, 2010). Currently, the company’s portfolio now includes twenty nine assets in eleven countries which include South Africa and several countries in East Africa such as Kenya and Tanzania among others (Friedemann, 2010).
The company’s activities span the full-cycle exploration and production chain in a continent that is the fastest expanding supplier of natural resources to the world’s leading markets (Afren.com, 2011). Having maintained a well built local demonstration on the company’s board and management teams and close relationships with home-grown companies and suppliers, these are Afren priorities. Thus making the Afren PLC the premier independent Exploration and Production Company listed in main market of London and an element of FTSE 250 (Afren.com, 2011).
Financial ratios
The firm operating margin as shown by Table 1 increased throughout the years by 5.26% to 22.99% in 2010, this implies that the firm was able to control the cost of production and operating cost, which led to improved efficiency and profitability in 2010. The profit margin improved in 2010 compared with 2009, as it increased by 24% implying that the firm efficiency in controlling cost of production had improved in 2010. In 2007 the returns earned by the company’s owners were very low but this increased with time as in 2010 the return on capital employed (ROCE) ratio had increased by 122% to 5.37% in 2010 implying that the shareholders earned more returns in 2010.
In 2007 the firm had been financed by 50% of debt which increased to 81.91% meaning that the firm was highly geared but the net gearing in 2010 was low compared to 2009 at 14.85%. The firm was more liquid in 2007 as measured by quick ratio but the ratio decreased by 77% to 0.59, while the current ratio also followed the same trend as quick ratio since it changed by 73% to 0.72 in 2010, but quick ratio is more preferable as it does not include stock or inventory.
As indicated in Table 2, Afren PLC expected Price/Earnings ratio is below the sector average of 9.45x and the market of 11.89x, this means that the value is below the sector and market average plus the firm’s shareholders will take less years compared to the market and sector to recoup back their earnings.
Afren PLC is more profitable compared to its competitor but less profitable compared to the market in general, as its ROCE is more than the sector though less than the market, this means that the firm owners’ earnings are more than the competitors’ shareholders. The firm efficiency is better than the competitors and the market as the company is able to control its cost of operation and production. The Earnings per share (EPS) growth indicates that the firm’s shareholder expect less compared to the industry average but more than the market. If the company and the competitors were liquidated the firm’s shareholders would have earned more per share held compared to the sector and the market as measured by Price to tangible book value.
The graph below shows that Afren PLC outperformed the market in 2007, 2009, and 2010.
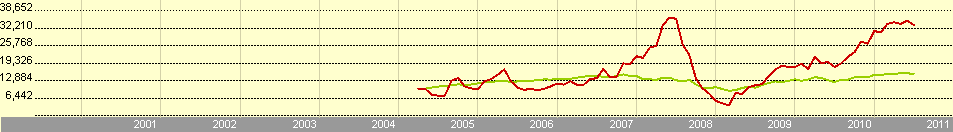
Key:
- Afren PLC – Equity
- FTSE 100 TR GBP – Benchmark
Price chart
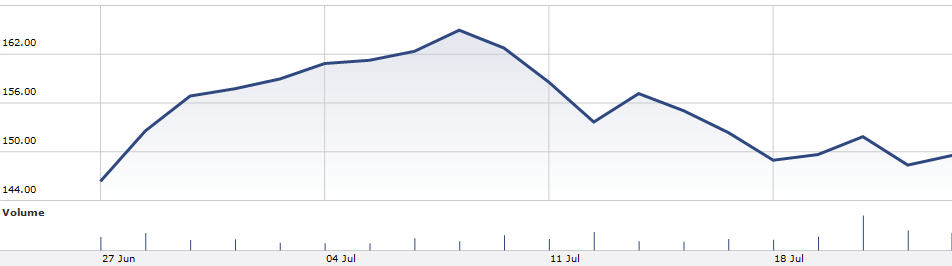
The above chart shows Afren share price movement for almost one month starting 27th June, 2011 to 22nd July, 2011. The stock price on 27th June for instance was at 146.50p, which then increased by 12.7% to165.10p on 7th July. The price started to drop which implied that from 7th July to 18th July the speculators who had bought Afren PLC shares were selling them in order to make capital gains, this activity led to decrease in price making it a bear market. The prices increased slightly by 4% from 149.1p to 149.7p on 22 July. On 25th July, 2011 the stock closed the day at 157.55p with a change of 6.1% plus a trading volume of 3,693,178. The firm has a market capitalization of 1.331 billion (Morningstar.co.uk, 2011).
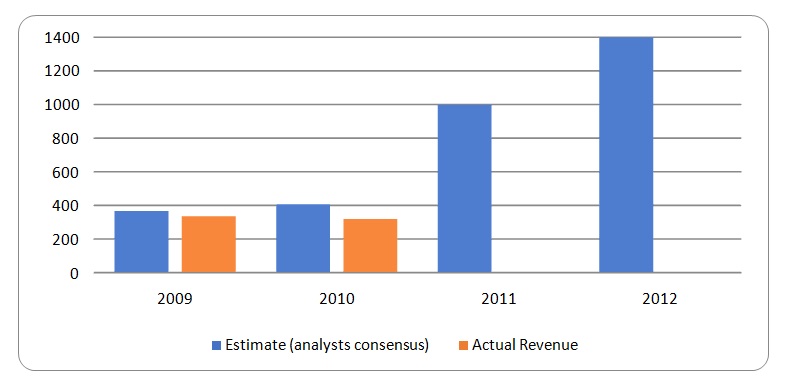
Analyst Earnings Forecast
In 2009, the estimated earnings as shown by Table 3 was ranging from a low of $343M to a high of $402M in which 10 analysts had agreed upon $367M, but the actual earnings turned out to be $336M, thus the variance was $31M compared to the consensus amount. In 2010, the analysts had forecasted that the earnings will be between $297M and $752M though the actual revenue for the firm was $319M which was within the expected range (Thomsonib.com, 2011); in this case 18 analysts had agreed on $407M thus the variance from the actual was $88M (Bloomberg.com, 2011). The expected revenue this year (2011) is $998M but the analysts estimates that the next financial year (2012), revenue will be between $766M and $1.8B, which 20 analysts have agreed will be $1.4B. Therefore, if the analysts’ prediction turns out to be true that is $1.4B in 2012 the earning will have increased by 40.28% compared to fiscal year 2011 and 317% compared to financial year 2009 as shown by the graph below (Bloomberg.com, 2011).
Apache Corporation
The company is amongst the well recognized, leading and self-governing crude oil and natural gas producers in the US because of its sizable oil reserves of approximately 600,000 oil barrels (Apache.com, 2011). It upholds exploration plus production efforts in many nations such as US, Ivory Coast, China, Australia, Poland and Egypt steered by its long-serving chairman and CEO (Raymond Plank), who is credited for creating and putting together the firm (Apache.com, 2011). The firm was formed by three partners in 1954 founded on three innovative principles which have shaped and directed the future of the company to meet the challenges of the globalized world (Percefull and Gary, 1989).
The company completed its first producing oil well in the year 1955 in Cushing Oklahoma when it only churned out a paltry 7 barrels each day (Apache.com, 2011). The second attempt, the company resulted in a well that produced over thirty barrels after every hour and as a result of a few successful drilling the company had ability to report a net profit of twelve thousand five hundred and thirty five US dollars in the same year from sales of one hundred and ninety thousand (Brown and Robert, 1985).
After company surviving its first year, the second year generated revenue of $630,000 and by the year 1959 the company had grown in to twenty three states and 2 Canadian provinces. After a decade of operations with Plank directives, the firm generated “$9.2M in revenues, $661,000 as net returns in addition to $9.3M as capital in the new drilling from the financiers in 1964” (Apache.com, 2011). In the financial year 1967, the corporation drilled expanded and increased its operation to an average of two thousand oil barrels in a day (Liesman et at, 1999).
In early 1960s and throughout 70s, the firm continued to expand by acquiring other firms and putting more efforts in attempting to lessen the consequences of oil industry crisis that was taking place then; during this time it instituted twenty four subordinate firms varying from Engineering plus Electronics Company to farming as well as water supply company (Apache.com, 2011). The corporation continued to diversify and increased it revenue and capital base by partnering with other firms to become a global company (Liesman et at, 1999).
Subsequent to the firm releasing the information that superior oil prices trend would have an impact on the non-oil plus non-gas producing subordinate, the corporation begun to formulate plans in the mid-1970s to get rid of its numerous diversified possessions.
The corporation lost an immense segment of its gas and oil operations in the financial year 1977 when it offloaded its Apexco subsidiary ordinate; nevertheless, it reinvested in the gas and oil operations plus in the early 1980s, it had yet again instituted itself as the principal player in the sector (Knott and David, 1997).
Subsequent to attaining noteworthy success with its oil and gas enterprises in the late 1970s the company formed the Apache Petroleum Company (APC) in the year 1981 and in early 1980s the company attracted nearly sixty thousand limited partners and Apache sales leapt to twenty two million US dollars by 1984 (2011). In the year 1985 and 1986 the net income fluctuated, this was because the market became glutted and the company reported its first full year loss of $10.9 million in 1986. Immediately the management teams and Plank started plotting a strategy for the future and the company demonstrated its ability to adapt change, in 1987 and 1988 the Plank had shown an absolute reorganization of the company (Fisher and Daniel, 1998).
In May, 1989 Plank issued a “Corporate Report Minnesota” and in October issued “Denver Business Journal” showing that the company was changing its approach of doing business and was getting aggressive on the independent sector of this industry (Fisher and Daniel, 1998).
In 1990s, the corporation regained its reputation and continued its expansion of growth strategy; this was done through the purchase of the gas plus oil reserves and enlargement of the existing reserves, as well as increasing its raw materials supply which led to a minimum production of 225m barrels (Apache.com, 2011). In late 1994, the company obtained the oil and gas production assets of Crystal Oil Company which were mainly situated along the Arkansas Louisiana boundary and in Southern Louisiana for one hundred and one million US dollars. In the first quarter of the financial year 1995, the corporation purchased part of Texaco Inc field worth $571m in Texas Louisiana as well as in the Rocky Mountains (Apache Corp, 1996). Also in the same year it purchased out Calgary based DEKALB Energy Company in a $285 million stocks exchange (Apache.com, 2011).
The corporation’s expansion to overseas continued in the financial year 1996 through 1997, the firm turned out to be the principal independent oil as well as gas operator in Egypt, as it gained control of Phoenix Resource Companies in the fiscal year 1996 (Maverick, 1995). The year after that, the corporation together with its associates in Khalada Concession, agreed on twenty five years contract worth $1.2B, which enabled the firm to make the natural gas available to Egyptian General Petroleum Corporation (Maverick, 1995). Apache acquired its first functions in Poland in the year 1997 in April when it started operations near Lublin, Southeast of Warsaw (Maverick, 1995).
The Asian economic crisis which started in 1997 was the main factor besides the virtual down fall of OPEC in an oil surplus that made prices to reduce. In 1999, the corporation also completed two large purchases; for instance, the corporation finished $746m of cash plus stock deal, which made the corporation to own 22 fields of oil plus gas in the Mexican Gulf from shell exploration as well as production business which is one of the departments of Shell Oil Corporation (Apache.com, 2011). In the early 1999, the firm was manufacturing “29,000 barrels on average, and gas amounting to 0.125b cubic feet every day” and by 1998, the corporation was producing “73,000 barrels of oil plus gas holdings on average from Alberta, Saskatchewan as well as British Columbia which was restricted for $0.517b” (Maverick, 1995).
The corporation has diversified internationally and has regional offices and operations in the US, Egypt, Australia, UK North Sea and Argentina (Apache.com, 2011). In 2010 Apache’s market capitalization was estimated at $30 billion while the company’s proved reserves at year end 2009 totaled 2.37 billion barrels of oil (2011).
Financial ratios
In 2010, the firm gross margin had increased by 20.57% as percentage of sales as shown by Table 5 compared to 2007 this implies that the firm cost of production was low in 2010 when compared to 2007 thus the firm efficiency had improved throughout the four years as well as its profitability. Operating margin was at a low level in 2010 compared to 2007 this means that the firm operating cost had increased by 12% which implies that the company did not control its operating costs efficiently thus reducing the profitability. The net margin decreased by 11% to 25.07% this implies that the overall costs such as cost of production, operating costs and finance costs were high in 2010 compared to 2007. The firm return on assets employed in the business was low in 2010 has it had decreased by 21% meaning that from year 2008 to 2010 the firm was inefficient in utilization of its assets, plus the firm’s earnings to owners also decreased by 22% due to increase in inefficiency.
Apache Corporation earnings in 2007 were more compared to the market as measured by the S&P 500 TR.
Table 6 shows that the firm performed better than the market throughout the four years (2007 to 2010) although its return had dropped by 67% to 19.8 in 2010 compared to 2007 while S&P 500 or the market had increased by 405% to 18.7 in 2010 compared to 2007. The graph below shows that ever since 2001 to mid-2011the firm returns were high than the market (S&P 500) thus Apache Corporation outperformed the benchmark.
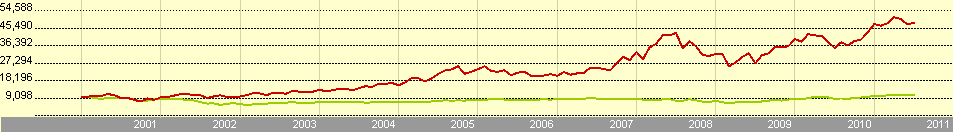
Key
- Apache Corporation – Equity
- S&P 500 TR – Benchmark
Price chart
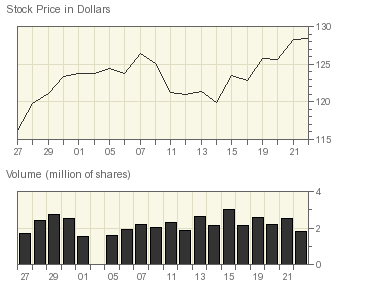
The above chart shows share price movement for almost one month starting from 27th June, 2011 to 22nd July, 2011. On 27th June the price was at $116 which increased throughout the period to 7th July, implying that many investors bought more shares in this period forcing the prices to go up as a result of market forces; this is a bullish market behavior. The share price started to decrease on 7th July through 14th July meaning that the price had reached the pick and most speculators opted to sell their shares forcing prices to drop by 5% to $120. The price began to increase on 14th to $128.5 on 22nd July, this means that the share price had increased by 7.1%. On 25th the stock closed the day at $128.31, a decrease of 0.15% with a trading volume of 206,394 (Thomsonib.com, 2011).
Analysts Earnings Forecast
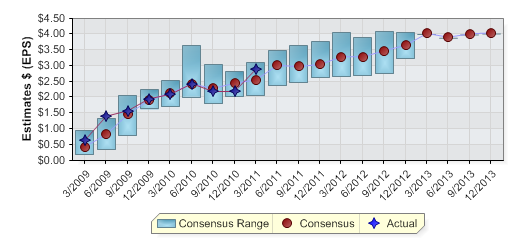
Table 4 shows that the analysts forecast for Apache Corporation Earnings per Share (EPS) were $12.19 in the financial year 2010 but the actual returns that the owners earned were $8.92 per share held in the company. Therefore the earnings variance was $3.27(negative), meaning that the firm did not meet the target.
In 2011 and 2012 the analysts project that the firm’s shareholders will earn $12.13 and $13.42 respectively (Thomsonib.com, 2011). This means that the firm’s earnings are expected to reduce by 4.92% in 2011 compared to 2010 and increase in 2012 by 10.63% based on 2011 fiscal year expected earnings per share, thus the firm profitability is expected to be high in 2012 compared to 2011 (Apachecorp.com, 2011) as shown by the graph below.
The graph below indicates that EPS increased in the fiscal year 2009 through 2010 and also in the last two quarters of the year 2011. It is also estimated that the EPS will continue to increase in the third and fourth quarter of this year (2011) as well as in 2012 and 2013 (Thomsonib.com, 2011).
Reformulated Financial Statements
In order to decompose ROCE into leverage and operating constituent one need to understand the fundamental balance sheet and income statement relationships. The standard income statement and balance sheet, where the balance sheet or statement of financial position equates equity and total liabilities to total assets may be reformulated to differentiate between financial and operating activities (Penman, Richardson and Tuna, 2007) as follows.
Afren PLC’s operating assets (OA) in the year 2007 were at $971.51M, which increased in 2008 by 101% to $1,952.169M but in 2010 the amount dropped by 26% to $1,446.488M. Operating liabilities (OL) followed the same trend as OA since they are related that is they determine the firm’s liquidate plus they are used by the company to generate revenues. In 2010 the firm’s OL dropped by 72% to $314.626M as shown by table below (Thomsonib.com, 2011).
The Net Financial Assets or Liabilities (NFA or NFL) is the difference between financial assets (FA) and financial liabilities (FL), in 2010 Afren PLC did not have any financial assets since it had liquidated all its derivative instruments and other investments. However, in 2008 the firm had the highest financial assets at $49.726M where 86.57% of these financial assets were sold in 2009 and at the end of the financial year 2010 all financial assets were liquidated. Afren PLC’s financial liabilities dropped by 33% in 2008 to $273.147M in 2010 this means that the company paid its obligations to the owners of the financial assets (Thomsonib.com, 2011). In 2007, 2008 and 2009 Afren PLC made losses due to high cost of production, operating costs and financing costs thus the company was not able to control the costs of doing business, but in 2010 the net income (NI) had increased by 373% to $45.873M (Thomsonib.com, 2011).
Apache Corporation’s operating assets have increased by 52% to $43.425B in 2010 while the operating liabilities have increased by 8.5% to $10.713B as shown by the table below. Apache Corporation financial assets decreased by 100% in 2010 to zero compared to 2007 financial year and financial liabilities reduced by 75% to $240M in the same period (Thomsonib.com, 2011). In 2009, the Apache Corporation’s cost of doing business was very high because it earned net loss of $285M in that particular year, this amount increased by 1164% to $3,032M in 2010 (Thomsonib.com, 2011).
Results
Analyzing ROCE
The above table shows Afren PLC data of ROA and ROE drivers; ATO and ROA respectively. Firm’s ATO and ROA move in the same direction, that is as ATO increases ROA also increases and as ATO decreases the ROA also decreases. Equally, as ROA increases the ROE also increases and as it decreases ROE also decreases.
Apache Corporation’s ATO increased in 2008 by 22% and decreased by 46% and 9.8% in 2009 and 2010 respectively, whilst ROA decreases by 71% and 105% in year 2008 and 2009 respectively and it increases by 4848% in 2010. Equally, ROE follow the same trend as it driver ROA as shown above.
Afren PLC Vs. Apache Corporation
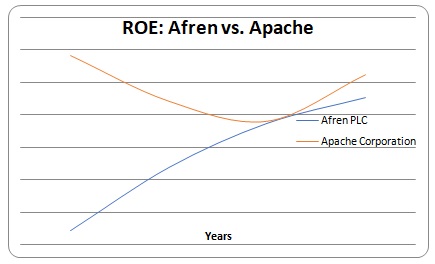
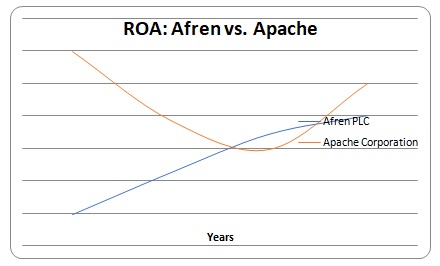
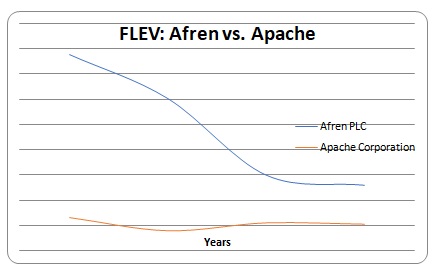
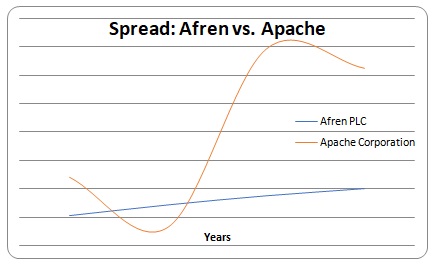
Comparing both firms, it is evident that Apache Corporation is doing better than Afren PLC in terms of ROE; ROE is decomposed into ROA, spread and financial leverage drivers that is described as ROA minus the borrowing cost. ROE at Afren is motivated by superior financial leverage although it is lessened by low spread plus ROA, contrasted with ROE at Apache that is driven by superior spread and ROA as indicated by the above four graphs.
Afren PLC and the UK firms
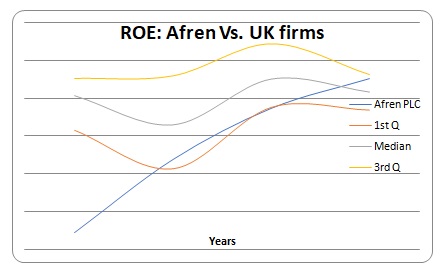
The above graph indicates that Afren PLC profitability was lower when compared with its competitors in the UK, than third quartile, the median and the first quartile in 2007, although higher from 2008 to 2010 than the first quartile and superior in 2010 than the median. The Afren PLC general trend was stable throughout the four years.
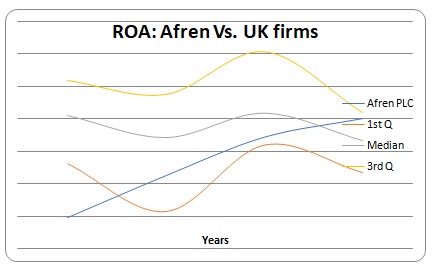
As shown by the above graph, the Afren PLC’s ROA increased progressively from 2007 to 2010, plus in 2008 and 2009 it was between the first quartile and the median but superior in 2010 than the median.
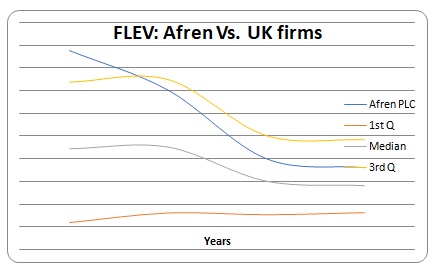
The FLEV of Afren PLC was higher than third and first quartile and median in 2007 but from 2008 to 2010 it was between the third quartile and the median. The Afren PLC trend was steady from 2008 to 2010 as shown by the above graph.
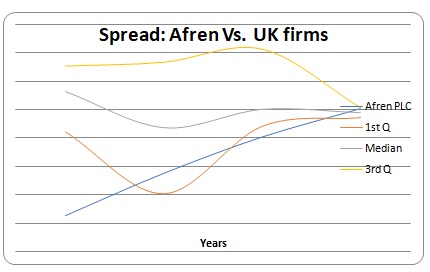
The spread of Afren PLC was the highest in 2008 than the first quartile, but lower than the median and the third quartile. Although, it was superior in 2010 than the median and this trend continued throughout the four years as shown by the above graph.
Apache Corporation and the US. firms
The above graph shows that Apache profitability was lower than the third quartile throughout the four years and higher than median in 2007 but lower in 2008. The profitability was higher and lower than the median in 2009 and 2010 respectively.
Apache’s ROA was the same as the third quartile and the median but higher than the first quartile from 2007 to 2009 and in 2010, Apache’s ROA was the same with other firms in the U.S. as shown by the above graph.
The FLEV of Apache was between the first quartile and the median from 2007 to 2010 but at the beginning of the year 2007 and end of 2010 it was below the first quartile, showing a steady trend throughout the years compared to the US firms, which shows an increasing trend.
Apache’s trend was in the same level as the median and third quartile but higher than the first quartile from 2007 to 2009. In 2010, the median, first quartile, third quartile were almost the same at the end of 2009 and thoughout the year 2010.
Conclusion and Discussion
This study analysed Afren PLC and its competitors in the UK and also Apache Corporation with its competitors in the U.S., incontext of the current performance in the situation of the industry’s operations. In doing so this paper used Penman analysis of profitability, where ROE was decomposed by its drivers such as the ROA, FLEV and spread. The finidngs of this paper indicates that in terms of ROE, Apache Corporation (US) performed better than Afren PLC (UK) that is, the profitability of Apache Corporation was superior than Afren PLC throughout 2007 to 2010.
Afren PLC was not superior than the third quartile when compared with its UK competitors, although on the whole it performed on average in this industry. Additionally, Apache Corporation performed on average when compared to the U.S. companies from 2007 to 2010, although in general, it performed better than the first quartile.
This paper also provides basis for future research in several ways; first of all, it demonstrates how ROE can be decomposed by various drivers in order to measure the profitability of firms within the sector over time. Additional research may decompose other types of ratios such as liquidity, activity and investment ratios into various drivers in order to determine how the firm is performing when compared to other companies within the industry. This would convey additional insight on the best performing companies in terms of these ratios, plus the best firm that an investor can choose from the alternatives available.
Secondly, this paper identifies the next area of research to be in the area of non-financial information analysis in determining the firms’ profitability plus the future research may explore the possible relations amongst firms in the sector.
References
Afren.com. 2011. About Afren. Web.
Apache Corp. 1996. Timely Major Expansion Program. Oil and Gas Investor. 7(5): 12-13.
Apachecorp.com. 2011. About Apache. Web.
Bloomberg.com. 2011. Afren PLC (AFR: London). Web.
Brown and Robert M.1985.The First Thirty Years of Apache Corporation, Minneapolis: Apache Corp. Journey into Risk Country. 1(3):88-115.
Drake, P. P. 2009. Financial ratio analysis, Web.
Fairfield, P. M., & Yohn, T. L. 2001. Using asset turnover and profit margin to forecast changes in profitability. Review of Accounting Studies, 6:371-385.
Fisher and Daniel. 1998. Dry Powder: Unlike Many of Its Competitors, Apache Saw Lower Oil Prices Coming, Cut Its Spending, and Sold Assets,’ Forbes, 5(6):214-230.
Friedemann. C. 2010. Oilvoice. Web.
GoldmanSachs.com. 2011. BRICs. Web.
Hambrick, D. C. 1984. Taxonomic approaches to studying strategy: some conceptual and methodological issues. Journal of Management, 10(1): 27-41.
Jermias, J. 2008. The relative influence of competitive intensity and business strategy on the relationship between financial leverage and performance. British Accounting Review, 40:71–86.
Knott and David. 1997. Apache Hunts Gas for Regulated Markets: Oil and Gas Journal. 14(4): 40-52.
Liesman, Steve, Carlos.T, and Christopher Cooper. 1999. Major Minors: As Big Oil Gets Bigger, Its Leftovers Provide Feast for Independents. Wall Street Journal. 7(2): 12-20
Maverick. 1995. Apache’s Septuagenarian Boss Thinks Everyone in the Oil and Gas Industry Has It Wrong,’ Financial World. 2(4):44-45.
Meir, L. 2008. Financial ratio analysis, Web.
Microstrategy.com. 2011. Financial Analysis, Web.
Morningstar.co.uk. 2011. Afren PLC AFR. Web.
NASDAQ.com. 2011. Stock Research: Earnings surprise. Web.
Nissim, D., & Penman, S. H. 2001. Ratio analysis and equity valuation: from research to practice. Review of Accounting Studies, 6:109-154.
Nyse.com. 2011. Apache Corporation. Web.
Penman, S. 2010. Financial statement analysis and security valuation (4th ed.). New York: McGraw-Hill.
Penman, S. H., Richardson, S.A., and Tuna, I. 2007. The Book-to-Price Effect in Stock Returns: Accounting for Leverage, Journal of Accounting Research, May: 427-467.
Percefull and Gary. 1989. Denver Independent Most Active Driller in Oklahoma. Tulsa World. 5(1):55-65.
Singh, P., & Agarwal, N. C. 2002. The effects of firm strategy on the level and structure of executive compensation. Canadian Journal of Administrative Sciences, 19(1): 42–56.
Soliman, M. T. 2008. The use of dupont analysis by market participants. The Accounting Review, 83(3):823-853.
Thomsonib.com. 2011. About us. Web.