Introduction
Background of ESI-MS
Research studies by Tang et al (2001:1658-1663), Bruins (1998:345-357) and Kebarle and Tang (1993:972A-985A) reported that ElectronSpray ionization (ESI) is a method that is employed in mass spectrometry to produce charged particles. Bruins (1998:348) reported that ESI is employed to molecules of high molecular mass because it has potential to overcome fragmentation of the molecular or intra-molecular rearrangement.
Jason S. Page, Ryan T. Kelly, Keqi Tang & Richard D. Smith, (2007), Ionization and Transmission Efficiency in an Electrospray Ionization-Mass Spectrometry Interface.
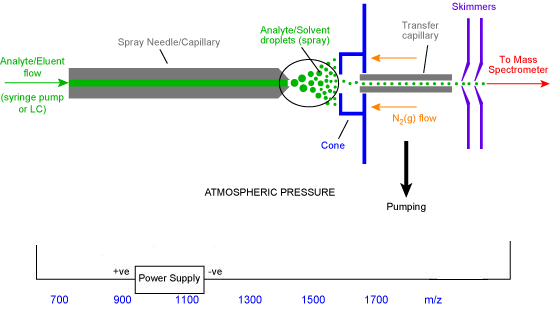
Kebarle and Tang (1993:975A) indicated that the mechanism through which ESI is achieved involves dispersion of a liquid that contains the analyte into a finely divided aerosol. According to Page et al (2007:1585), the mechanism involves a solvent that is prepared from a solution of water and a volatile organic compound like methanol or acetonitrile. Page et al (2007:1586) indicates that Acetic acid is added in the volatile solvent in order to help in decreasing the droplet size. Page et al (2007:1588) suggested that inert gases like Neon, Helium or argon are used for nebulization but in most cases nitrogen gas is commonly employed if large flow electrosprays are to be implemented.
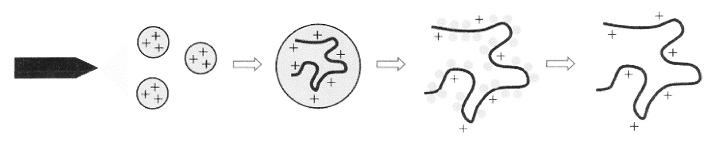
This process is summarized in the figure 1 below, where the analyte which is a macromolecule is introduced to the source as a homogeneous solution from a syringe or in form of an effluent flow in case of a liquid chromatography (Kebarle and Tang, 1993:979). Tang et al (2001:1661) and Hubert (2003:361) agree that the rate of flow is standardized to 1 μl min-1. Page et al (2007:1588) argue that the analyte sample flows into electrospray needle. Page et al (2007:1589) reports that the electrospray needle has a very high potential difference (pd) as measured from counter electrode. The pd has a range of 2.5 KV to 4.0 KV.
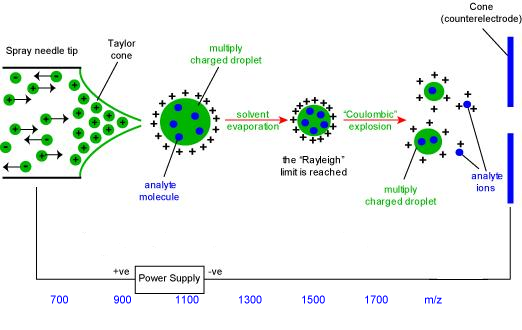
Page et al (2007:1589) have pointed out that the step is implemented in order to force spray of the charged fine droplets from the needle. Bruins (1998:351) argues that the droplets have same surface charge as the charge on the needle. Due to similarity of charges (Stewart (1999:1653), the law of charges applies and the droplets are repelled towards the source sampling cone on the counter electrode (in figure 1 it is blue in colour).
Jason S. Page, Ryan T. Kelly, Keqi Tang, Richard D. Smith, Ionization and Transmission Efficiency in an Electrospray Ionization-Mass Spectrometry Interface.
Page et al (2007:1586) indicate that as the finely charged droplets move across the space between the needle tip and the cone, solvent evaporation occurs (in figure 1, it is represented by a circled region which is expanded in figure 2 below).
Bruins (1998:349) argues that the finely divided aerosol is forced into the first phase of the mass spectrometer via a capillary. Page et al (2007:1584) argue that the first stage is heated to result into solvent evaporation. Bruins (1998:351) reported that the solvent evaporates from the droplet, because it has higher volatility and forms first vapour fraction before the analyte attains its vapourization. Page et al (2007:1585) indicated that this occurs because the solvent attains its Rayleigh limit. Accordingly (Bruins 1998:352), at Rayleigh limit, deformation of the droplet occurs resulting into emission of a charged stream via a process termed as Rayleigh fission. In the process of Rayleigh fission, the droplet loses percentage of its mass and charge.
Andries P. Bruins, 1997, ESI source design and dynamic range considerations.
Statement of the Problem
Studies on speciation analysis have been geared towards detection of unknown chemical molecules, identification, structural elucidation and quantitative properties. Research work on quantification have in the past directed to a target element where ICP-MS have been proposed to be able to provide best results that are a function of sensitivity and compound independent response. Other studies have reported that although ICP-MS is efficient, the plasma source or atomizer, damages crucial information like species characterization that is exposed to threat of limitation to retention time that chromatography can provide. However, use of retention time in order to determine a specific unknown species calls for standards that cannot be attained by other techniques except by using ESI-MS.
Aims and Objectives of the Study
- To determine the ESI-MS in the positive and negative modes of Luthenium complex
- To carry out analysis of two proteins namely lysozyme and cytochrome by ESI-MS
- To carry out mass determination and correlation of charge distribution of electrospray mass spectra in the protein sequence by using MaxEnt and Mass Lynx computer software
Literature Review
Bruins (1998:346) reported that mass spectral analysis of proteins and ligands has characteristic disadvantages brought about by large molecular masses that are beyond range for many mass spectrometers. Tang et al (2007:1583) indicated that before ESI-MS was developed, some of ionization methods that were employed in studies included Fast Atom Bombardment (FAB) which is dependent on excitation states, ionization energies, analysis of singlet, duplet and triplet states. Tang et al (2007:1583) reported that the success of FAB depends on production of singly charged ions. Hubert (2003:357) argued that FAB worked best with sector instruments that had potential to attain m/z 8 kDa. Tang et al (2001:1661) proposed that the demand for the instrument to achieve a m/z 8 kDa was a limitation to chemical analysis.
Lobinski, Schaumloffel and Szpunar (2006:257) reported that limitation to analysis subject to failure of instruments to attain a 8 kDa lay in the digestion of the protein and preceded by analysis of the digested mixture. Lobinski, Schaumloffel and Szpunar (2006:287) reported that multiple charges obtained in ESI are statistically distributed on the site of the protein.
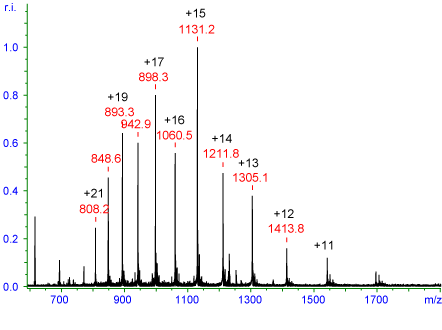
Manisali, Chen, and Schneider (2006:245), in figure 5 below illustrate a Horse heart myoglobin that was carried out at 16.9 kDa. Manisali, Chen, and Schneider (2006:246) reported that the peaks observed are subject to multiple charging affect. The charges are Gaussian distributed around the +15 charge state that ranges from +22 to +10. Similarly, Page et al (2007:1584) indicated that the distribution of the charges depends on electrospray conditions such as charge distribution and gross tertiary structure of the protein.
Irina Manisali, David D.Y. Chen, Bradley B. Schneider, Electrospray ionization source geometry for mass spectrometry: past, present, and future
McSheehy and Mester (2003:312) reported that ESI-MS provides opportunities for soft ionization for metal containing species like ligands for instance chlorophyll or haemoglobin. Bruins (1998:355) argues that Tandem mass spectrometry results into precise determination of molecular mass and structural characterization of trace quantities of molecules that are present in complex matrices.
McSheehy and Mester (2003:313) argue that ESI-MS utilizes three basic approaches in principle to characterize unknown molecules. The three identified techniques are identification of the molecular mass using high resolution QTOF or FTICR systems, identification of isotope patterns and determination of the elements in the molecular species.
Hansen et al (2002:S16) reported that evolution of speciation analysis into the field of metallomics and metabolomics has been contributed by spread of electrospray tandem quadrupole and quadrupole time of flight (Q-TOF) mass spectrometers that are employed in analytical laboratories. This is also coupled with hyphenation with high resolution techniques for separation like the HPLC and CE techniques.
Page et al (2007:1583) reported that medical drugs are analyzed by using ESI-MS. Hansen et al (2002:S16) reported that some of techniques that have been employed in structural studies include Cone voltage fragmentation with a single MS instrument, collisionally induced dissociation (CID) with triple quadrupole MS instruments, MS techniques using quadrupole ion-trap instrumentation and time-of-flight mass spectrometry (ToFMS).
Page et al (2007:1586) provides that organic molecules that have a molecular mass below 1000 daltons are studied using ESI signals that corresponds to their [M+H] + ions. According to Page et al (2007:1587), some of the low molecular mass organic molecules include antibiotics, steroids, anti-diabetic drugs, anti-tumour drugs, erectile dysfunction agents, anti-epileptic drugs, b-blockers, anti-asthmatic drugs and psychoactive drugs like tranquillizers.
ESI-MS can be run on negative ion mode or positive ion mode. The molecule should however satisfy one condition, it should have at least one polar end before the charged particles can be formed by positive ion adduction or proton loss to form a carbanion or anion. Non polar molecules cannot therefore form ion in ESI-MS. The solvent that should be used should have potential to realize sufficient vapour pressure during vapourization process.
Methodology of the Study
Section 1: Inorganic Complexes
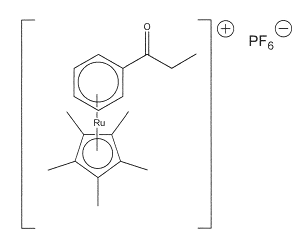
The Ruthenium Complex: ESI Mass Spectral Analysis Method
- Determine the mass spectrum for the positive mode and the negative mode (select the region in the chromatogram, process by combining spectra (RH mouse button), then subtract blank, then OK) this should bring up the mass spectrum
- In each spectrum, identify the parent peak and indicate what species is present from the ruthenium complex
- Expand the parent “peaks” (using the LH mouse button) in your experimental spectrum and print the mass spectrum (label m/z values to two decimal places for ions above 1% abundance)
- Using the species present in the positive mode spectrum, determine the theoretical isotope pattern for this part of the complex
- Carry out an isotope analysis of the ruthenium complex by combining the theoretical isotope pattern with the experimental isotope pattern. (To calculate the experimental isotope pattern, use the Tool menu and then isotope model and enter the formula)
Section Two: Protein Analysis
- With the raw data, using the MAxEnt Software deconvolute the spectra to deduce the M of the neural compound and determine the value of the MW of the protein.
- When doing this, select a Da range to deconvolute over with a resolution of 1 Da/channel. The uniform Gaussian height peak width should be measured from the spectrum as this is representative of the isotopic distribution of the macromolecules. Select a representative peak with good symmetry from the spectrum and by using the left mouse button drag and measure the width manually.
- Then select iterate till converges
- (Smoothing of the raw spectral data should not be done before deconvolution, smooth only the output result from the MaxEnt.
- Use the menu items: MaxEnt, OK. Check that the uniform Gaussian window is >1Da
- Average between 5 and 10 mass spectra for each protein
- Apply smoothing parameters (peak width 4 and 1Da) using the menu items (Process, Smooth)
- In a new window, obtain the centroid mass spectrum and label ions to one decimal (peak width 4 and centroid 80% using the menu items (process, centre
- Print each MaxEnt profiles and centroid mass spectra
Deliverables
- Calculate the maximum charge for the two proteins
- Compare the results from B1 to charge state distribution observed in the ESI mass spectra
- Explain why the charge state distributions for the two proteins differ when these samples were both analyzed at similar solution condition (PH and Solvent)
Results
Resentation
Discussion of the Results
The Inorganic ESI-MS of Ruthenium Complex
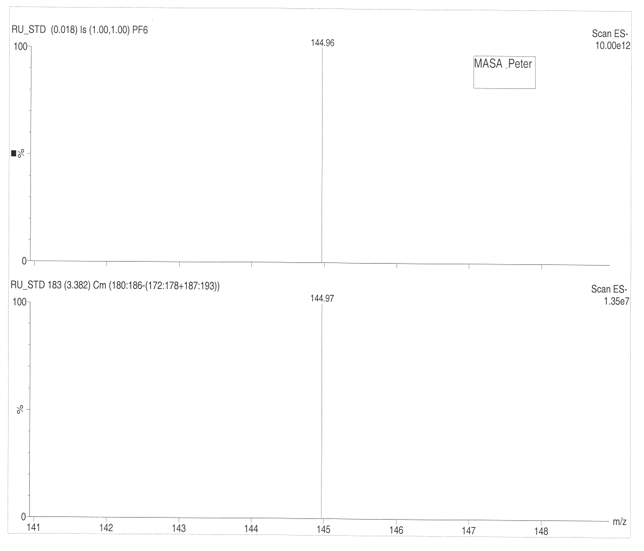
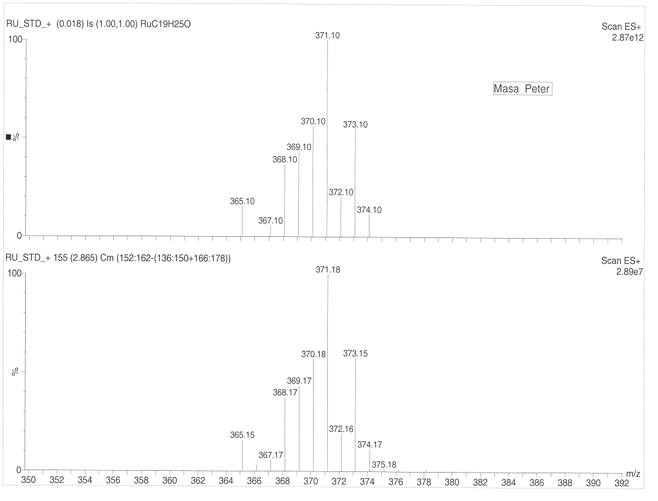
The parent peak for the Ruthenium complex occurs at 371.10 followed by 370.10, 373.10, 369.10, 368.10, 372.10, 365.10, 374.10 and 367.10. The primary isotope for the Ruthenium according to scale ES+ 2.87e12 has a relative atomic mass of 371.10. Finer results are obtained by using scale ES+2.87e7 (figure 7a, 7b) that gives maximum peak of 371.16.The ruthenium complex has a molecular mass of 144.97 at ES+ 10.00e12 and ES+ 1.35e7.
The Organic ESI-MS of Cytochrome and Lysozome
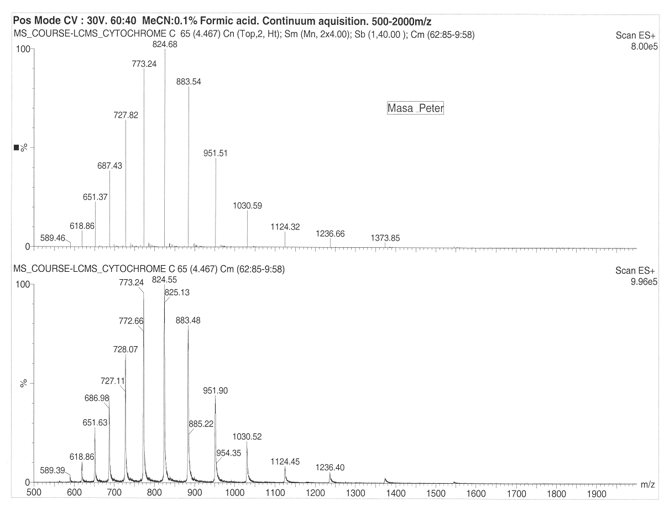
The maximum charge of the cytochrome was found to lie between 27+ to 21+ respectively. The maximum observed charge for the lysozyme was found to be 10+ to 14+. The comparative data on the charge state distribution for the cytochrome and lysozyme suggests that there exists a small angle neutral scattering intensity distribution that is subject to an increase in intensity at a small wave factor. This can be interpreted in terms of presence of a weak long range attraction that occurs between the protein amino group in the protein chain.
The observed ion mobility occurs due to increasing number of charges on the cytochrome ion meaning drift occurs faster hence possibilities of increased higher mobility of the ions. It can also be proposed that a change in drift time or changes in protein conformation either through folding or unfolding is indicator of ion mobility in the lattice. From the results, multiple peaks are observed subject to more folding of the polypeptide. Cytochrome produced 13 peaks while lysozyme produced 42 peaks.
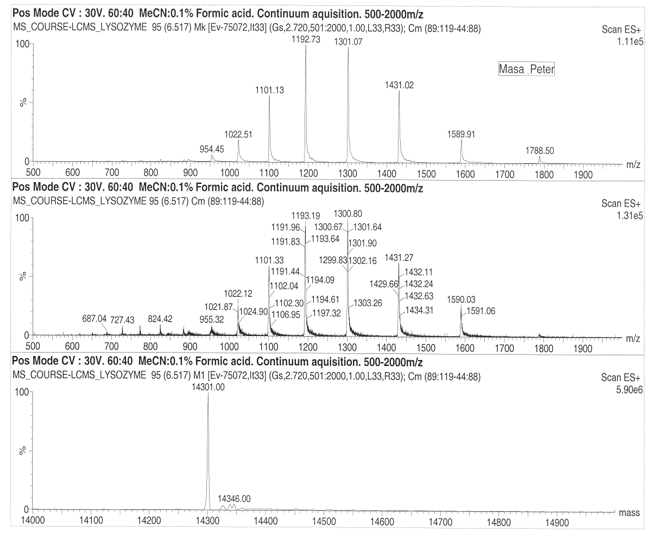
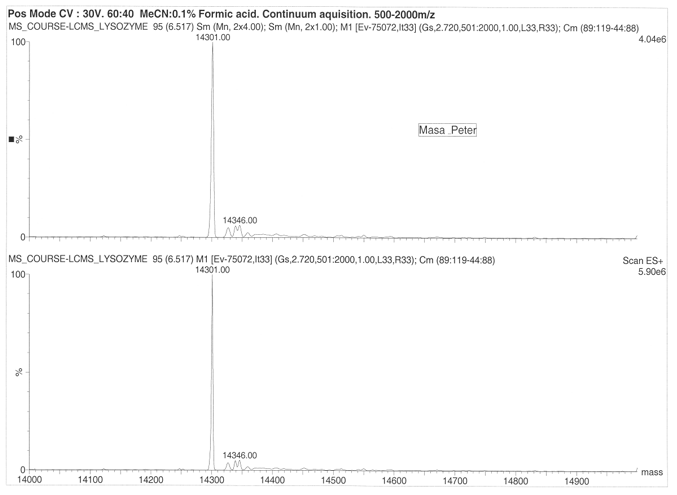
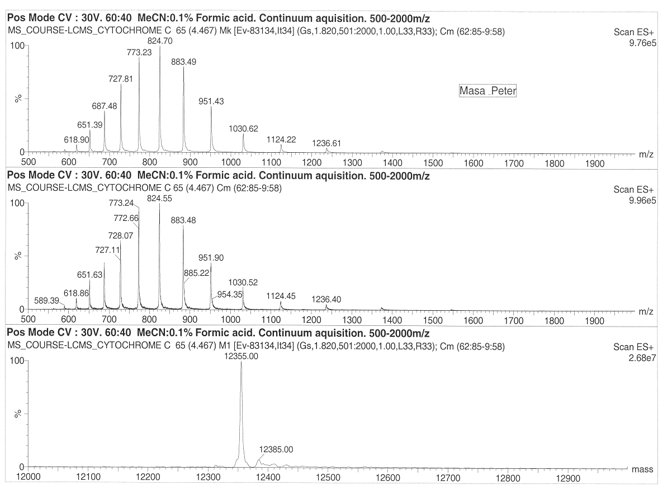
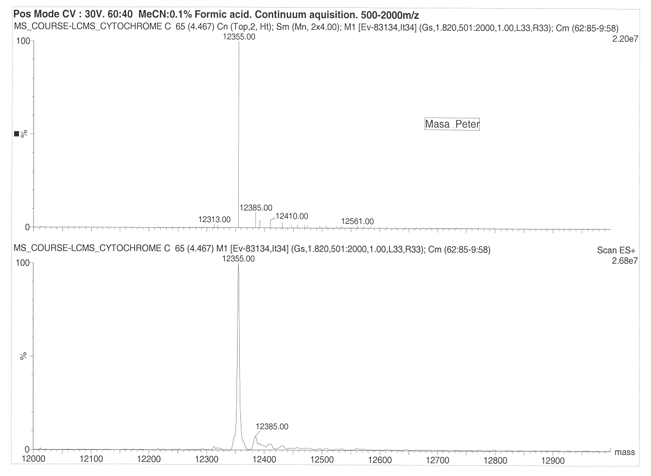
On considering drift ration with respect to rate of mobility of the ion, it appears a folded ion drifts at higher rate that a non-folded ion. The change in distribution occurs from +11 to +5 and shift in protein conformation is to the order of +11 to +8 for the higher state and +7 to +5 for the lower charge states. Cytochrome exhibited 13 peaks with parent peak occurring at 824.55 at 830 m/z. the lysozyme produced a parent peak at 1193.19 and another major peak at 1300.80. The molecular mass of the lysozyme was found to be 14346 for both ES+ 5.90e6 and ES+ 4.04e6. On the other hand, cytochrome was found to have a molecular mass of 12355.00 at ES+ 2.20e7 and ES+ 2.68e7.
List of References
Bruins, A.P., 1998: Mechanistic aspects of electrospray ionization, J. Chromatogr. A, 794 (1-2) pp. 345-357.
Hansen, S.H., Bendahl, L., Gammelgaard, B., Jons, O., and Farver, O., 2002, Hyphenation of CE to ICP-MS and to sheathless electrospray-MS for high sensitivity and selectivity in bio-analysis, Chromatographia, 55 (Sup.), S15-S19.
Hubert Chassaigne, Electrospray Methods for Elemental Speciation, in: Rita Cornelis, Joe Caruso, Helen Crews, Klaus Heumann (eds), Handbook of Elemental Speciation: Techniques and Methodology, John Wiley & Sons, Chichester, 2003, pp. 356-377.
Kebarle, P. and Tang, L.,1993: From ions in solution to ions in the gas phase: The mechanism of electropspray mass spectrometry, Anal. Chem., 65 (22), 972A-985A.
Lobinski, R., Schaumlöffel, D., and Szpunar, J. 2006, Review: Mass spectrometry in bioinorganic analytical chemistry, Mass Spectrom. Rev., 25, pp. 255-289.
McSheehy, S. and Mester, Z., 2003, the speciation of natural tissues by electrospray-mass spectrometry: II: Bioinduced ligands and environmental contaminants, Trends Anal. Chem. (Pers. Ed.), 22 (5), pp. 311-326.
Manisali, I., Chen, D. D.Y., and Schneider, B. B., 2006, Electrospray ionization source geometry for mass spectrometry: past, present, and future, Trends Anal. Chem. (Pers. Ed.), 25(3); 243-256.
Page, J.S., Kelly, R.T., Tang, K. and Smith, R.D., 2007, Ionization and Transmission Efficiency in an Electrospray Ionization-Mass Spectrometry Interface, J. Am. Soc. Mass Spectrom., 18 (9),pp 1582-1590.
Stewart, I.I., and Horlick, G., 1996, Developments in the electrospray mass spectrometry of inorganic species, Trends Anal. Chem. (Pers. Ed.), 15 (2), pp 80-90.
Stewart, I.I., 1999, Electrospray mass spectrometry: a tool for elemental speciation, Spectrochim. Acta, Part B, 54 (12) pp. 1649-1695.
Tang, K., Lin, Y., Matson, D.W., Kim, T. and Smith, R.D., 2001 Generation of Multiple Electrosprays Using Microfabricated Emitter Arrays for Improved Mass Spectrometric Sensitivity, Anal. Chem., 73 (8) pp. 1658-1663.