
Introduction
The concept of microeconomics focuses on the allocation of resources in markets and looks at more specific processes to provide a framework for understanding the workings of the industry. For example, the management of scarce resources, supply and demand dynamics, and equilibrium prices are analyzed and focused on according to the scenario. This essay examines key concepts and processes related to their purpose and specialization, and a comprehensive examination of the topics will help identify the peculiarities of the interaction of economic forces. Given the inherent procedures and mechanisms, it is evident that forward and backward linkages enable markets to maintain balance amid an ever-changing landscape and environment.
Management of Scarce Resources
Economic Problem
To begin with, it is worth paying attention to the basic formulation of the economic problem in the context under consideration. It is presented as a fundamental lack of the necessary resources amid an almost unlimited number of human desires (Liu et al., 2022). In other words, it implies the importance of making choices because achieving all goals at once is unrealistic. Thus, what is meant is the division of effort at all levels to prioritize competing goals, among which are capital, land, labor, and others. As for the designations of goals themselves, they are quite broad – they can range from necessities to luxuries, and the pervasive problem of economic activity is displayed in the corporate, community, or individual environment.
Specialization and Its Benefits
The notion of specialization is closely related to the economic problem theory outlined earlier and implies a focused concentration on a narrow range of tasks or activities. Undoubtedly, this property can also be owned by organizations or individuals, as well as by entire states or areas of the economy that prefer to direct productive activities in a separate area (Lashkaripour, 2020). Such a manifestation enables a more targeted development of expertise within groups and increased overall efficiency, with a significant impact on productivity. Accordingly, allocating resources through specialization can be used most productively, thereby improving the quality of goods and services. However, specialization promotes interdependence, which may not always be beneficial but definitely encourages cooperation and creativity.
Separately, four economic benefits affect overall efficiency when specialization is present. The first of these would undoubtedly be productivity gains, i.e., the focus of individual actors on tasks in which they may have a comparative advantage (Bucci and Ushchev, 2021). This fact also contributes to resource savings and potential success in the industry. The second benefit, however, is the facilitation of trade, as the diversity of services and goods allows specialization and the honing of skills in one’s trade, while expanding consumption opportunities by enabling the exchange of surpluses for missing goods.
This point is closely linked to the next one, facilitating progress in procedures and technological processes, as better work enables innovation, diversification of the offer, and competitiveness (Deegan, Broekel, and Fitjar, 2021). The fourth sign of benefit, on the other hand, is the overall economies of scale already briefly mentioned in the previous paragraph. Lower average costs and more affordable prices for consumers are a logical result of increased production volume.
Trade-Off and Opportunity Cost
In the same context, it is equally important to mention the concepts of trade-offs and opportunity costs. The former is also a fairly basic concept, recognizing that a decision must sacrifice one option or benefit in favor of another (FTE, 2024). In other words, an opportunity cost is the value of the next-best alternative that is usually foregone when making a decision.
Each choice entails trade-offs in the economic problem described by the generalist; it follows that allocating limited resources to one purpose means giving up the benefits of using them for another purpose. An example of this is each student’s choice between preparing for an exam and going to a party. Having scarce resources and time, each chooses to study, which requires sacrificing the opportunity to socialize as an opportunity cost of their decision.
Theory of Demand, Supply, and Price
Features of a Competitive Market
A competitive market is characterized by several basic features that are directly related to its actual functioning and that define its existence. Initially, it must be understood that there are many sellers and buyers, each of whom cannot individually possess significant market power or influence prices. Accordingly, this indicator is determined not by a single entity but by the combined forces of supply and demand (Birt, 2023).
At the same time, products in a competitive market are standardized and quite homogeneous, i.e., practically identical to the buyer in terms of purpose. This increases price transparency and spurs competition in pursuit of quality and brand reputation. Entry and exit from the market are relatively easy, which discourages monopolistic behavior and supports innovation by allowing new firms to enter and preventing existing ones from relaxing. This is accompanied by the free flow of information in a competitive market, making informed decisions possible on both sides of the buying process. A single example of such an understanding market is the agricultural bazaar.
Determinants of Demand
Demand determinants are the most influential factors that affect the quantity of goods buyers desire. These include income, price of related goods, preferences, demographics, and expectations. The income level of consumers directly affects purchasing power and demand; for example, higher income leads to greater demand for luxury goods, such as designer bags and shoes. At the same time, the price of related goods affects everything; a classic example is coffee, which can increase demand for tea or other beverages, and vice versa.
Consumer preferences significantly shift demand but are less predictable, as the trend towards healthy lifestyles can emerge independently across society and increase interest in organic products. Demographics adjust demand based on age or cultural distribution; i.e., as a nation’s average age increases, health services become more popular. Price and income expectations, on the other hand, correlate with all of the above manifestations and are more related to current purchasing decisions. For example, the expectation of higher gasoline prices will prompt citizens to queue at gas stations to avoid future higher costs.
Shifts in a Demand Curve
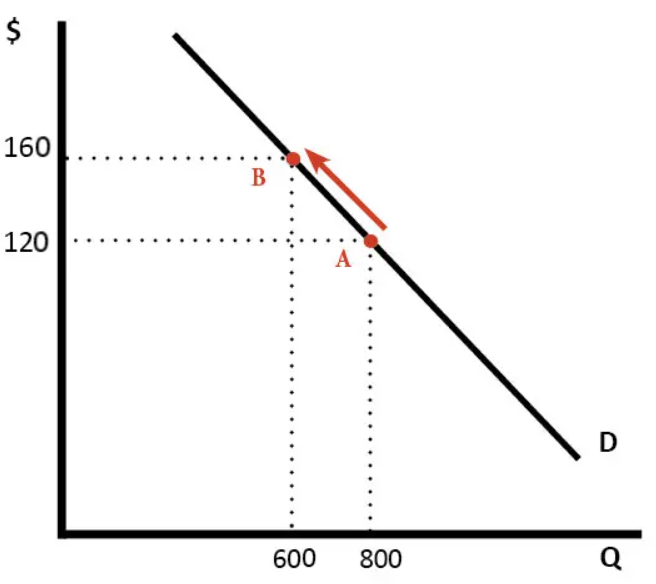
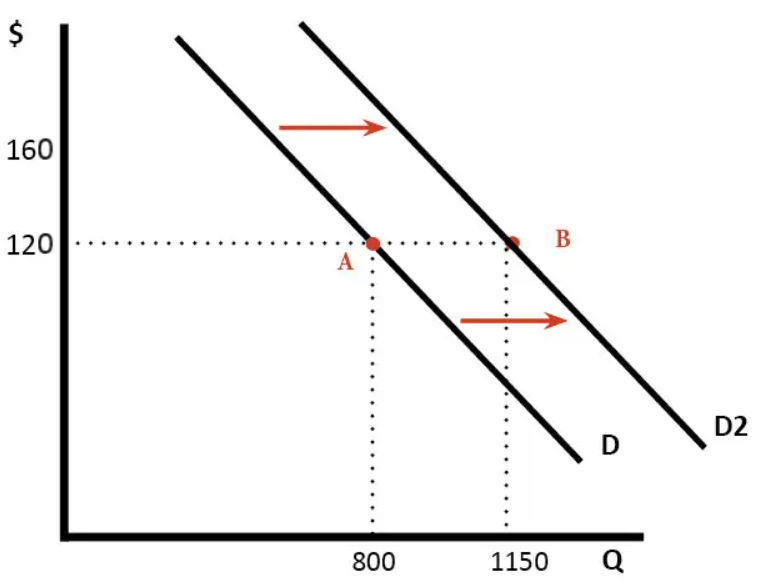
A demand curve shows the change in demand volume at each price point, independent of price. For example, the shift in preferences towards healthier eating and its impact can be noted and analyzed in more detail. Coinciding with a large-scale public health campaign, consumer sentiment is shifting, and consumers are increasingly favoring organic products over junk food. Accordingly, demand rises proportionately, shifting the curve to the right. As for the demand for previously popular snacks, its curve shifts to the left due to a decrease, which in general demonstrates changes in non-price factors as actors in the modification of consumption patterns.
Price Elasticity and Income Elasticity
Depending on the price, demand volume also varies, and the concept of numerical elasticity measures the response to this phenomenon. Thus, it quantifies how demand for a good responds to a price change, and if the response is large, the good is called elastic. If, on the other hand, a large price change affects demand only slightly, the good is inelastic (Beck and Lein, 2020). The gasoline example presented earlier is elastic because price changes can significantly affect sales. It can be contrasted with rare drugs, which, even if the price rises, will be sold almost at the original level. Understanding this is crucial for businesses and policymakers, as it allows them to predict the consequences of price changes more confidently.
A parallel concept is income elasticity, which measures the response of demand magnitude to changes in people’s income levels. This indicator can be zero or even negative, suggesting a low-quality product. A positive elasticity, on the other hand, emphasizes the attractiveness of a service or product and suggests that demand will increase as society’s income increases. An example is luxury clothing and cheap appliances: if income increases, demand for luxuries rises, indicating positive elasticity. In contrast, the demand for cheap, low-quality products falls, and vice versa.
Determinants of Supply
The determinants of supply influence the quantity of a product offered: the number of sellers, technology, production prices, expectations, external conditions, and government regulation. An increase in the number of sellers usually increases supply when competition intensifies, and prices fall, as seen when the total quantity of the grain crop increases with a large seasonal number of farmers specializing. Technology is beneficial for efficiency and supply expansion, as evidenced by automation in production.
Factors of production have their cost and condition, as well as the ability of the organization to create a commodity, such as the price of raw materials or fertilizers for farmers. Expectations are parallel to demand, but on the seller’s side, which allows them to adjust the quantity of their product on the market depending on the profitability at the time. Conditions also involve natural factors, such as drought or flooding, which can destroy agricultural production. Policies finally include subsidies, taxes, and regulation, and an increase in the carbon tax raises production costs for many industries, reducing their supply.
Shifts in a Supply Curve
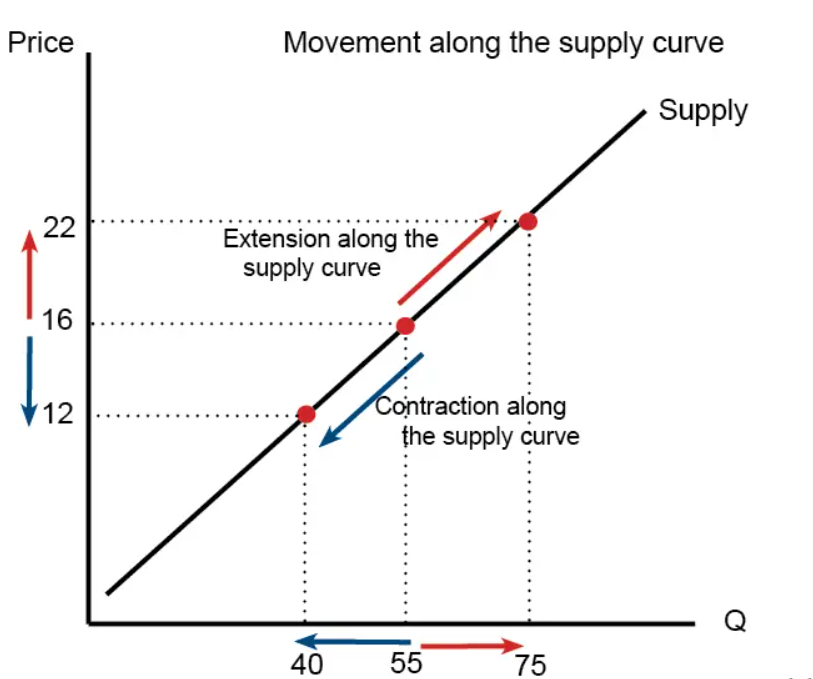
A shift in the corresponding supply curve also occurs when the volume of supply changes due to additional factors at the price point. The above examples of factors allow us to apply the impact of technological advances on the supply of manufactured goods. Suppose there is a breakthrough in manufacturing technology that makes it significantly cheaper to produce automobiles.
As a result, automobile manufacturers can produce cars more efficiently and at a lower cost. Thus, the product supply curve shifts to the right. If, however, steel and aluminum are in short supply due to a natural disaster, the cost increases, lowering profitability, which shifts the curve to the left. Such observations allow us to understand the significance of the potential impact of outside conditions.
Elasticity of Supply
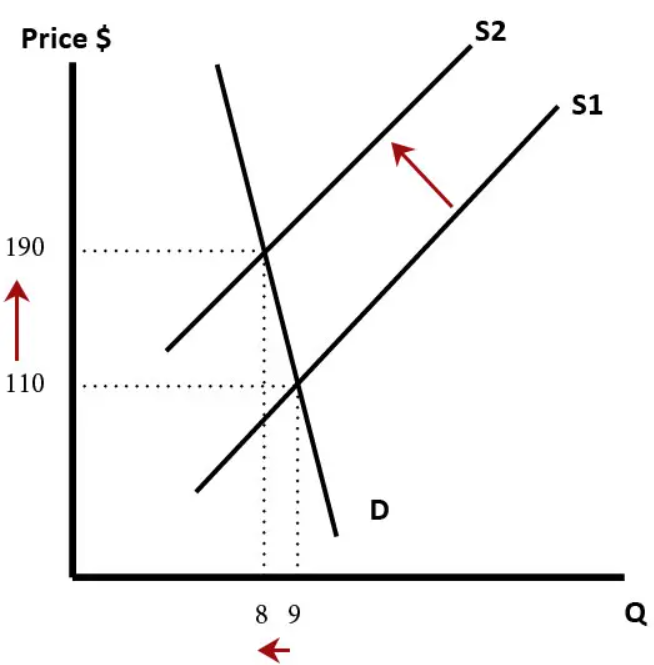
The elasticity of supply displays the degree to which the quantity of a commodity offered responds to changes in its price. In other words, it quantifies the percentage change in supply in response to a one percent change in price. Proportional elasticity is similar to the previous elasticities and is categorized in the same way.
It is calculated by dividing the increase in supply by the price; for example, a 10% increase in the price of corn seed will cause a 20% increase in the volume of supply in the market, which would indicate an elasticity of supply of 2. The reverse is the price of luxury, where a 10% higher price can only cause a 2% increase in supply, marking an elasticity of 0.2, i.e., inelastic. Interpretation of this concept is important to guide enterprises in the market processes.
Equilibrium Price Concept
Equilibrium Price and Quantity Determination
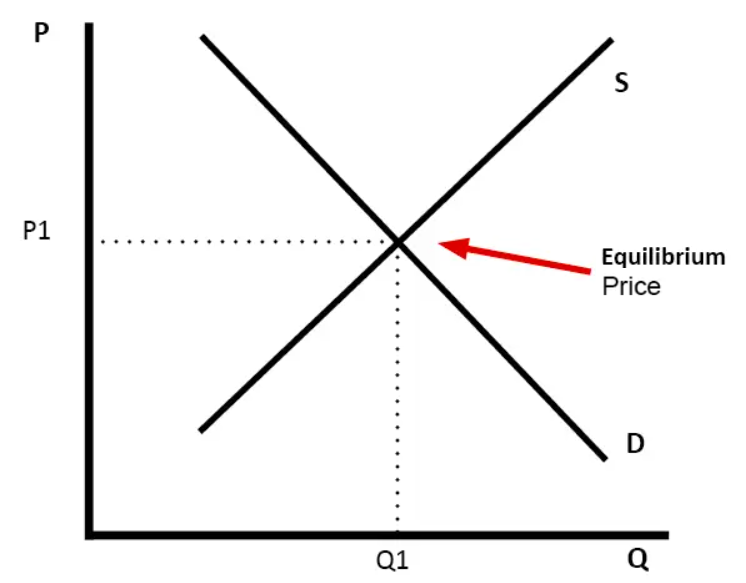
This part of microeconomics involves determining the ideal point of interaction between the forces of supply and demand. The equilibrium point implies equality of the volume of supply and demand of consumers and producers, which provokes a state of balance without excessive manifestations (Farrokhi and Soderbery, 2021). It is achieved by a price adjustment designed to equalize the market.
If the market price is initially above the equilibrium level, there is a surplus of goods, leading to downward pressure on prices as producers seek to sell excess inventory. As prices fall, the volume of demand increases, and the volume of supply decreases until equilibrium is reached, and vice versa. The process of such adjustment is continuous, and market forces act to reach equilibrium and allocate resources efficiently.
Surplus becomes the obvious consequence of the volume of demand exceeding the volume of supply at the prevailing price. Such a surplus indicates an imbalance, in this case, the production of more goods than needed. Prices may be lowered in response, but this may not be the optimal solution for all types of goods.
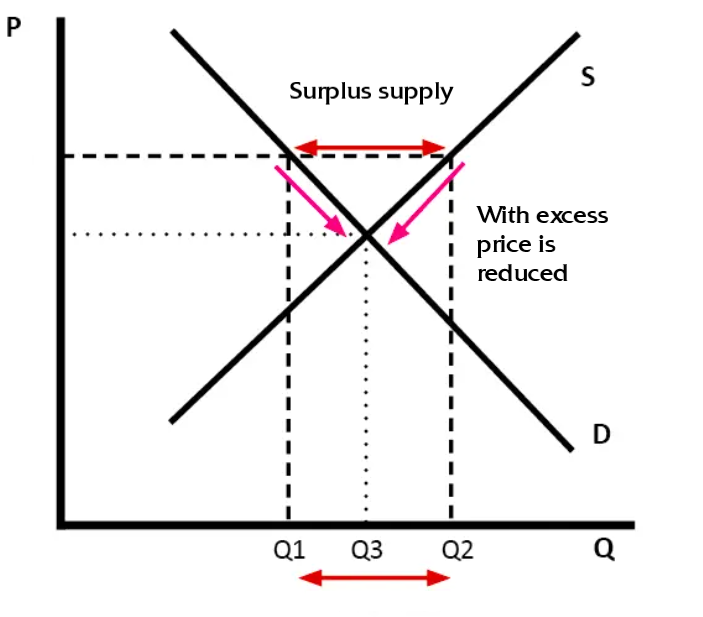
As prices, in general, fall, people are more inclined to buy, and producers reduce volumes, which guides them toward equilibrium. The downward pressure on prices continues until the surplus disappears, and the alternative is only a direct reduction in production, where a change in prices would not be necessary. Either way, the main goal is precisely to reach equilibrium, and this dynamic process clearly depicts the market’s response to imbalance.
Change in Equilibrium Position
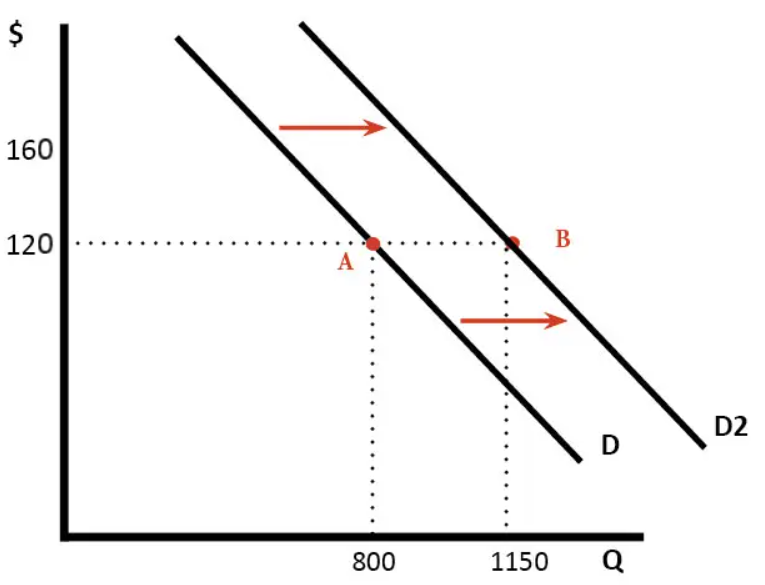
The equilibrium point, however, can be shifted due to movements in the demand or supply curves. Analyzing such changes best depicts such an observation and can be explained with an example. The previously stated increase in consumer desire for healthy food due to awareness of its importance leads to an increase in demand for the corresponding products.
At the same time, the demand curve moves to the right, and the equilibrium price and quantity of such products increase, reflecting the higher demand. This is due to a greater desire to buy organic products, and producers are forced to raise prices to meet the increased demand. The market thus adjusts to a new equilibrium with increased sales and prices.
Conclusion
Thus, the complex interplay of economic forces and mechanisms to achieve balance is mandatory in the dynamic conditions of markets. Microeconomics in this context appears to be a basis for developing an understanding of this process in parallel to the study of the efficiency of resource allocation. The concepts studied in this paper suggest that market outcomes are dependent, and additional factor analysis helps in supporting this fact. The specifics of equilibrium prices and the determinants of supply and demand were also examined, helping to supplement and summarize existing knowledge.
Reference List
Beck, G. W. and Lein, S. M. (2020) ‘Price elasticities and demand-side real rigidities in micro data and in macro models,’ Journal of Monetary Economics, 115, pp. 200–212.
Birt, J. (2023) What is a competitive market? Indeed.
Bucci, A. and Ushchev, P. (2021) ‘Specialization versus competition: an anatomy of increasing returns to scale,’ Journal of Economic Geography, 21(3), pp. 461–486.
Deegan, J., Broekel, T. and Fitjar, R. D. (2021) ‘Searching through the haystack: the relatedness and complexity of priorities in smart specialization strategies,’ Economic Geography, 97(5), pp. 497–520.
Farrokhi, F. and Soderbery, A. (2021) Trade elasticities in general equilibrium. Purdue.
FTE (2024) Trade Offs and Opportunity Cost. Foundation for Teaching Economics.
Lashkaripour, A. (2020) ‘Within-industry specialization and global market power,’ American Economic Journal: Microeconomics, 12(1), pp. 75–124.
Liu, J. et al. (2022) ‘Resource provision and allocation based on microeconomic theory in mobile edge computing,’ IEEE Transactions on Services Computing, 15(3), pp. 1512–1525.