Abstract
This paper shows how the use of big data analytics could help to improve the activities of the New York Metropolitan Transportation Authority (MTA). In detail, it demonstrates that big data management techniques could help MTA to improve stakeholder relationships, enhance organizational performance, increase business transparency, minimize customer complaints, and promote the effective use of resources through data visualization. Key sections of this paper also highlight how MTA has struggled to adopt big data analytics in the identification and formulation of organizational problems and solutions. Based on a review of these contributions, this study demonstrates that big data analytics are integral to MTA’s future success.
The findings of this report could help to develop the foundation for the improvement of MTA’s data infrastructure. Based on the idea that these improvements would create opportunities for the enhancement of MTA’s data visualization techniques, the findings of this paper would also help to properly communicate the organization’s performance to its shareholders and improve its data analysis techniques. Through the understanding that big data analytics would help the authority to link its performance with its capital investments, the findings of this paper would similarly be instrumental in improving the importance of capital investments to its shareholders. Stated differently, the data analysis techniques highlighted in this paper would provide shareholders with a greater understanding of why and how MTA is using its money for the accomplishments of its goals. Thus, this paper shows that big data analytics are integral to MTA’s future success.
Introduction
Different people have used the term “big data” to define large amounts of data, new data assessment methods, and social media information processing techniques (Raj, Raman, Nagaraj, & Duggirala, 2015). According to Kanniyappan and McQueen (2015), “big data” refers to a collection of large and complex information that could be managed by sophisticated data analytical techniques because traditional methods of doing so do not have the capacity to accommodate such complexities. Regardless of the existing definitions and uses of big data, many organizations have started to understand its importance in information processing (Raj et al., 2015). This is why most of them have summed it up as a new way to process information for the improvement of organizational processes (Raj et al., 2015).
A study by IBM revealed that more than two-thirds of organizations that use big data have found that it creates a competitive advantage for their businesses (IBM Corporation, 2014). Others have documented how the use of big data has formulated unique solutions for some perennial organizational problems (Kanniyappan & McQueen, 2015). As such, big data analytics are helping organizations to transform their business processes and find new ways of revolutionizing entire industries (Raj et al., 2015). The same is true for the transport industry. This paper explains how the use of big data analytics could help to improve the activities of the Metropolitan Transportation Authority (MTA) in New York. It also demonstrates that big data management techniques could help to improve stakeholder relationships, enhance organizational performance, increase business transparency, minimize customer complaints, and promote the effective use of resources through data visualization. Key sections of this paper also demonstrate how MTA has struggled to adopt big data analytics in the identification of organizational problems and in the formulation of associated solutions. However, before delving into these findings, it is important to understand the New York MTA and its past data management techniques.
New York MTA
The MTA is a public service organization mandated to oversee and manage public transport services in New York. The main modes of transport managed by the authority include trains, buses, and subways. It operates in 12 counties within the state but has a business presence in Connecticut as well (Hanft, Iyer, Levine, & Reddy, 2016). According to the MTA Network (2016), the organization could transport 11 million people weekly. It could also transport 800,000 cars across its toll bridges and tunnels in any given working day (Open Text Corporation, 2015).
Based on its sheer size, MTA is considered the largest transport authority in America. In this regard, it generates a lot of data per day. The information is generated through the 2.7 billion trips it makes via different modes of transport under MTA, annually (MTA Network, 2016). This massive data is expected to grow in the future because estimates show that four out of five rush-hour commuters in New York use MTA (Open Text Corporation, 2015). Furthermore, statistics from Hanft et al. (2016) show that 85% of New Yorkers have to use an automobile to get to their places of work. Most of these people avoid traffic congestion by using the services offered by MTA. The Permanent Citizens Advisory Committee on MTA, which has advised the organization to use data visualization techniques to understand how its performance is pegged to its data management processes, has also reiterated the importance of using big data analytics (Shannon & Bellisio, 2013). Others have proposed that doing so would help it to link its capital investments with its performance (Hanft et al., 2016). This line of reasoning explains the focus of this study because we strive to explain how big data analytics could be useful to MTA. The following section of this report explains how MTA has historically managed data.
How MTA has historically Managed Data
According to the Open Text Corporation (2015), the MTA traditionally employed traffic checkers to collect data about its transportation services. Consequently, they developed reports using excel spreadsheets and presented them to the managers, quarterly. However, over time, MTA adopted new and more efficient ways of data collection that eliminated the need for traffic checkers. The NY General Transit Feed Specification is used to collect data about subway traffic. The organization also uses Google maps integration to generate data about the location of buses and trains. This information is relayed to a central data management point every 30 seconds, throughout the day (Open Text Corporation, 2015). MTA’s operations planning department also generates data for the organization by recording door and ramp movements, which relay information about passenger boarding or alighting numbers. Cumulatively, these agencies generate tens of thousands of records every minute. Similarly, they generate millions of rows of data per day. This information is supposed to be recorded and used by MTA to improve its service delivery standards. Although there is a wealth of data generated each day, from the millions of trips undertaken by MTA, there is no effective way of analyzing or distributing it. This challenge magnifies the need for a robust analytical reporting mechanism. This paper explores the potential of big data analytics in solving this problem. Some of the possible benefits MTA could enjoy by using this approach appear below.
Benefits of Big Data Analytics to MTA
Improved Stakeholder Relationships
It is necessary for MTA managers to satisfy the needs of their stakeholders because they are the main champions of the organization. The adoption of big data analytics in the organization would help MTA managers to improve their relationships with internal stakeholders. These stakeholders include employees, board members, contractors, and vendors (Shannon & Bellisio, 2013). Here, the organization should replicate the success it has experienced from the development of MTA apps that have helped it to improve its relationship with external stakeholders and do the same for its internal stakeholders by developing similar apps that would improve the relationship with this group of stakeholders. One strategy for doing so could involve adding unique data presentation capabilities to its annual presentation techniques to help the stakeholders understand what the organization has been up to (Raj et al., 2015). MTA could also employ a systematic analysis of organizational processes to address the needs of all stakeholders.
Asset management and improved data analytics could also help to support these strategies because researchers have demonstrated their efficacy at different levels of individual success (Shannon & Bellisio, 2013). Regardless of whether a manager is overseeing the organizational activities of departmental, or regional, units, their ability to gain access to past information or historical data would better improve their decision-making skills. Indeed, by employing effective data analytics, the managers could better visualize the impact of their decisions (Raj et al., 2015). For example, station managers could better prepare for bad weather conditions by looking at historical data concerning areas where accidents have occurred in the past. The introduction of software that captures different types of data, at multiple stations, could also provide fodder for the development of a harmonious data management center, which would identify stations that require more attention and the ones that are excelling. To aid in such processes, the software could be designed to capture information about accidents, injuries, service frequencies, waiting times, and similar data. Asset management techniques could also help departmental managers to be better and more efficient at achieving their goals. Improved access to relational databases to prepare accurate departmental reports is one way that such employees could use big data analytics for the improvement of their organizational tasks.
Enhanced Performance, Fewer Complaints, and Improved Transparency
The use of big data analytics by MTA could amount to enhanced performance and fewer complaints because the associated tools could help the organization to respond more effectively and faster to customer complaints. For example, Hanft et al. (2016) say the organization could easily troubleshoot the problems it has with its services after the installation of big data analytics. By taking action immediately, fewer customers would have a need to complain about transport services. The adoption of big data analytics will also improve the transparency of MTA’s organizational activities by making people understand how it makes decisions. This advantage relates to the reporting of fewer complaints because increased transparency in MTA activities would make its users understand why they are experiencing problems and what the company is doing to solve them. This information flow would increase commuters’ patience and make them more aware of the efforts made by the company to improve its organizational processes.
Consequently, the MTA should allow the public to gain access to information about its activities and refrain from being close-guarded about it. Shannon and Bellisio (2013) support this view by saying, “Transparency is a responsibility to share information that is readily and easily understandable or to give a tool or mechanism that can inspire people to learn what is true” (p. 8). Based on this statement, it is critical to point out that the MTA should not only avail information to the public but also give them the necessary tools to process it.
Different researchers have proposed unique tools that organizations, such as MTA could use for this purpose. For example, Aluya (2014) has proposed the use of interactive reports as a tool for data dissemination and consumption. Indeed, the MTA could use many digital publishing platforms to create interactive mobile reports that the public could use through their tablets, computers, or mobile phones. For instance, through what may easily be a PDF file, a user could click on different links that would redirect them to a website or a video file that would have interactive pieces of information about the organization’s activities. The iPad edition of National Geographic has successfully employed this method to disseminate information to its stakeholders (Shannon & Bellisio, 2013). MTA has the same capability. Concisely, as MTA considers moving its information processing and documentation processes from basic data management techniques to more sophisticated ones, it needs to look at the capability of machine-readable instruments and tools that would help it to maximize this potential.
Improved Data Visualization and the Effective Use of Resources
The employment of big data analytics in MTA could help it to operate more efficiently by improving its resource allocation processes. These tools could also improve data visualization metrics in the organization, thereby offering managers a performance snapshot that would be vital to their decision-making processes (Aluya, 2014). This tool would provide the managers with detailed information that would ultimately enable them to make better decisions and improve their effectiveness. Through improved functionality, MTA is naturally bound to improve its resource use for better investments-return ratios (Hanft et al., 2016). To demonstrate the prowess of big data analytics in MTA activities, the organization has reported high levels of success with the adoption of Actuate, a data analysis software.
To demonstrate the power of data visualization, Hanft et al. (2016) provide a case study depicting how MTA used Automatic Vehicle Location (AVL) systems to assess passenger behaviors in the Co-op City neighborhood, New York. Serving a population of about 35,000 people, MTA employed the AVL technique to improve service delivery in the community. The system used running time records to compare the actual number of runs made by MTA buses and the expected number of runs in the predetermined schedule. A pair review of the origin and destination statistics for members of the community gave the MTA enough information to identify which routes were the best to serve. The company got this information by visualizing the widths of travel arcs derived from AVL computations (Hanft et al., 2016).
Visualizing the origin to destination links within the AVL model also made the organization understand that its most important transportation function was ferrying people out of the neighborhood. Through this visualization technique, the company also understood that it was a feeder to most of the city’s subways that served the neighborhood (Hanft et al., 2016). Indeed, by tracking the travel data for all journeys that started in the Co-op neighborhood, the MTA established that they all ended out of the community. By understanding these ridership and service patterns, MTA was better able to serve the residents of the Co-op neighborhood. This is one representation of the power of big data analytics to MTA processes. It also demonstrates how the organization could benefit from improved data visualization and the effective use of resources by employing big data analytics.
Identification of Problems and Formulation of Solutions
The use of big data analytics could also help MTA identify some of the problems affecting its operations. In the past, the organization has used this technique to identify and solve problems associated with delayed bus arrival and departure times. Hanft et al. (2016) have documented the use of AVL data for this purpose as well. They say that it helped MTA to identify and solve some of the service quality issues reported on its M5 platform. The use of the technique pointed out that the buses operating on the M5 platform were the poorest performing. It also showed that the service quality standards of this platform were below 50% (Hanft et al., 2016). The wait assessment reports on the same platform showed that they were more than 70%. In one street, Houston Street, the AVL data assessment tool showed that buses were late 53.5% of the time (Hanft et al., 2016). Furthermore, it showed that 9 AM buses were late over 70% of the time (Hanft et al., 2016). These realizations forced the company to shorten some of its bus services on specific routes to improve the service delivery standards. From the understanding of these data, MTA was able to improve its service delivery standards. Comprehensively, when we look at the contributions of big data in the activities of the New York Metropolitan train services, we derive a value chain process characterized by five key stages. They include big data, effective analytics, better information insights, better decisions, and better designs, planning, and operations. This process appears below.
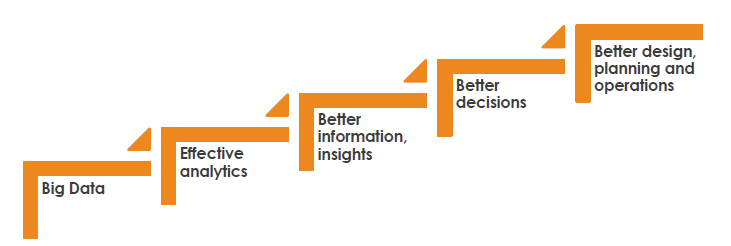
Based on the aforementioned value chain, we find that the usefulness of big data analytics for the MTA is integral in the development of good design, planning, and operational activities of the organization. This value is similar to the contribution of the internet on organizational activities because of its capability to provide accurate analysis of organizational data.
Conclusion
For MTA to benefit from the potential that exists in the adoption of big data analytics, it needs to overhaul its information-processing infrastructure to accommodate new methods of data processing. At the same time, it needs to change the culture and attitude surrounding its data management processes because, for a long time, it has closely guarded its data. Making these changes would greatly improve data accessibility in the organization and set the stage for the complete realization of the benefits of big data analytics. For example, the adoption of data visualization and analytical techniques would help the organization to present factual and easily comprehensible information to its shareholders. By adopting such a strategy, the MTA would be in a position to demonstrate to all stakeholders the true value of investments. Through the visualization of annual trend lines, the organization would also increase the transparency needed in managing its operations. This process would involve linking the massive amounts of data it possesses to current big data analytics. By doing so, the organization’s internal decision-making systems would be improved. Similarly, all stakeholders would be in a position to understand the complex issues affecting the organization, thereby providing a platform for all concerned parties to find a consensus on current and future issues affecting the organization.
References
Aluya, J. (2014). The influences of big data analytics. New York, NY: Author House.
Hanft,J., Iyer, S., Levine, B., & Reddy, A. (2016). Transforming bus service planning using integrated electronic data sources at NYC transit. Journal of Public Transportation, 19(2), 89-108.
IBM Corporation. (2014). Big data and analytics in travel and transportation. Web.
Kanniyappan, R., & McQueen, R. (2015). What’s the big deal about big data in transportation? Web.
MTA Network. (2016). Public transportation for the New York region. Web.
Open Text Corporation. (2015). New York City transit authority transforms route performance using BIRT for better data visualization and more transparent information. Web.
Raj, P., Raman, A., Nagaraj, D., & Duggirala, S. (2015). High-performance big-data analytics: Computing systems and approaches. New York, NY: Springer.
Shannon, E., & Bellisio, A. (2013). The MTA in the age of big data. Web.