Data Collection
The purpose of the activity was to survey at least 20 individuals to find out the number of minutes (on average) that they drive one way to work. Social media platforms were used to collect the sample, from which I wrote out all the names of my contacts with whom I could potentially correspond. I wrote out the names of my contacts (n = 53) in MS Excel, then used =RAND() to assign random values to each row. The values were sorted in ascending order, after which the first 22 lines were used. To these 22 people, I wrote on social networks, stating that I was conducting research, and specified the time they got from home to work by car or public transport. Thus, the final sample (n = 22) was randomly generated using a systematic probabilistic mechanism (McCombes, 2022). The choice of this particular strategy was motivated by the desire to minimize bias in the data, as well as the desire for independence and randomness. The only problem I encountered during data collection was constant clarification from respondents as to what mode of transportation they should name: car, bus, or bicycle. I asked them to name what they use most often so the data is not specific to a particular vehicle, region, or age.
Data Organization
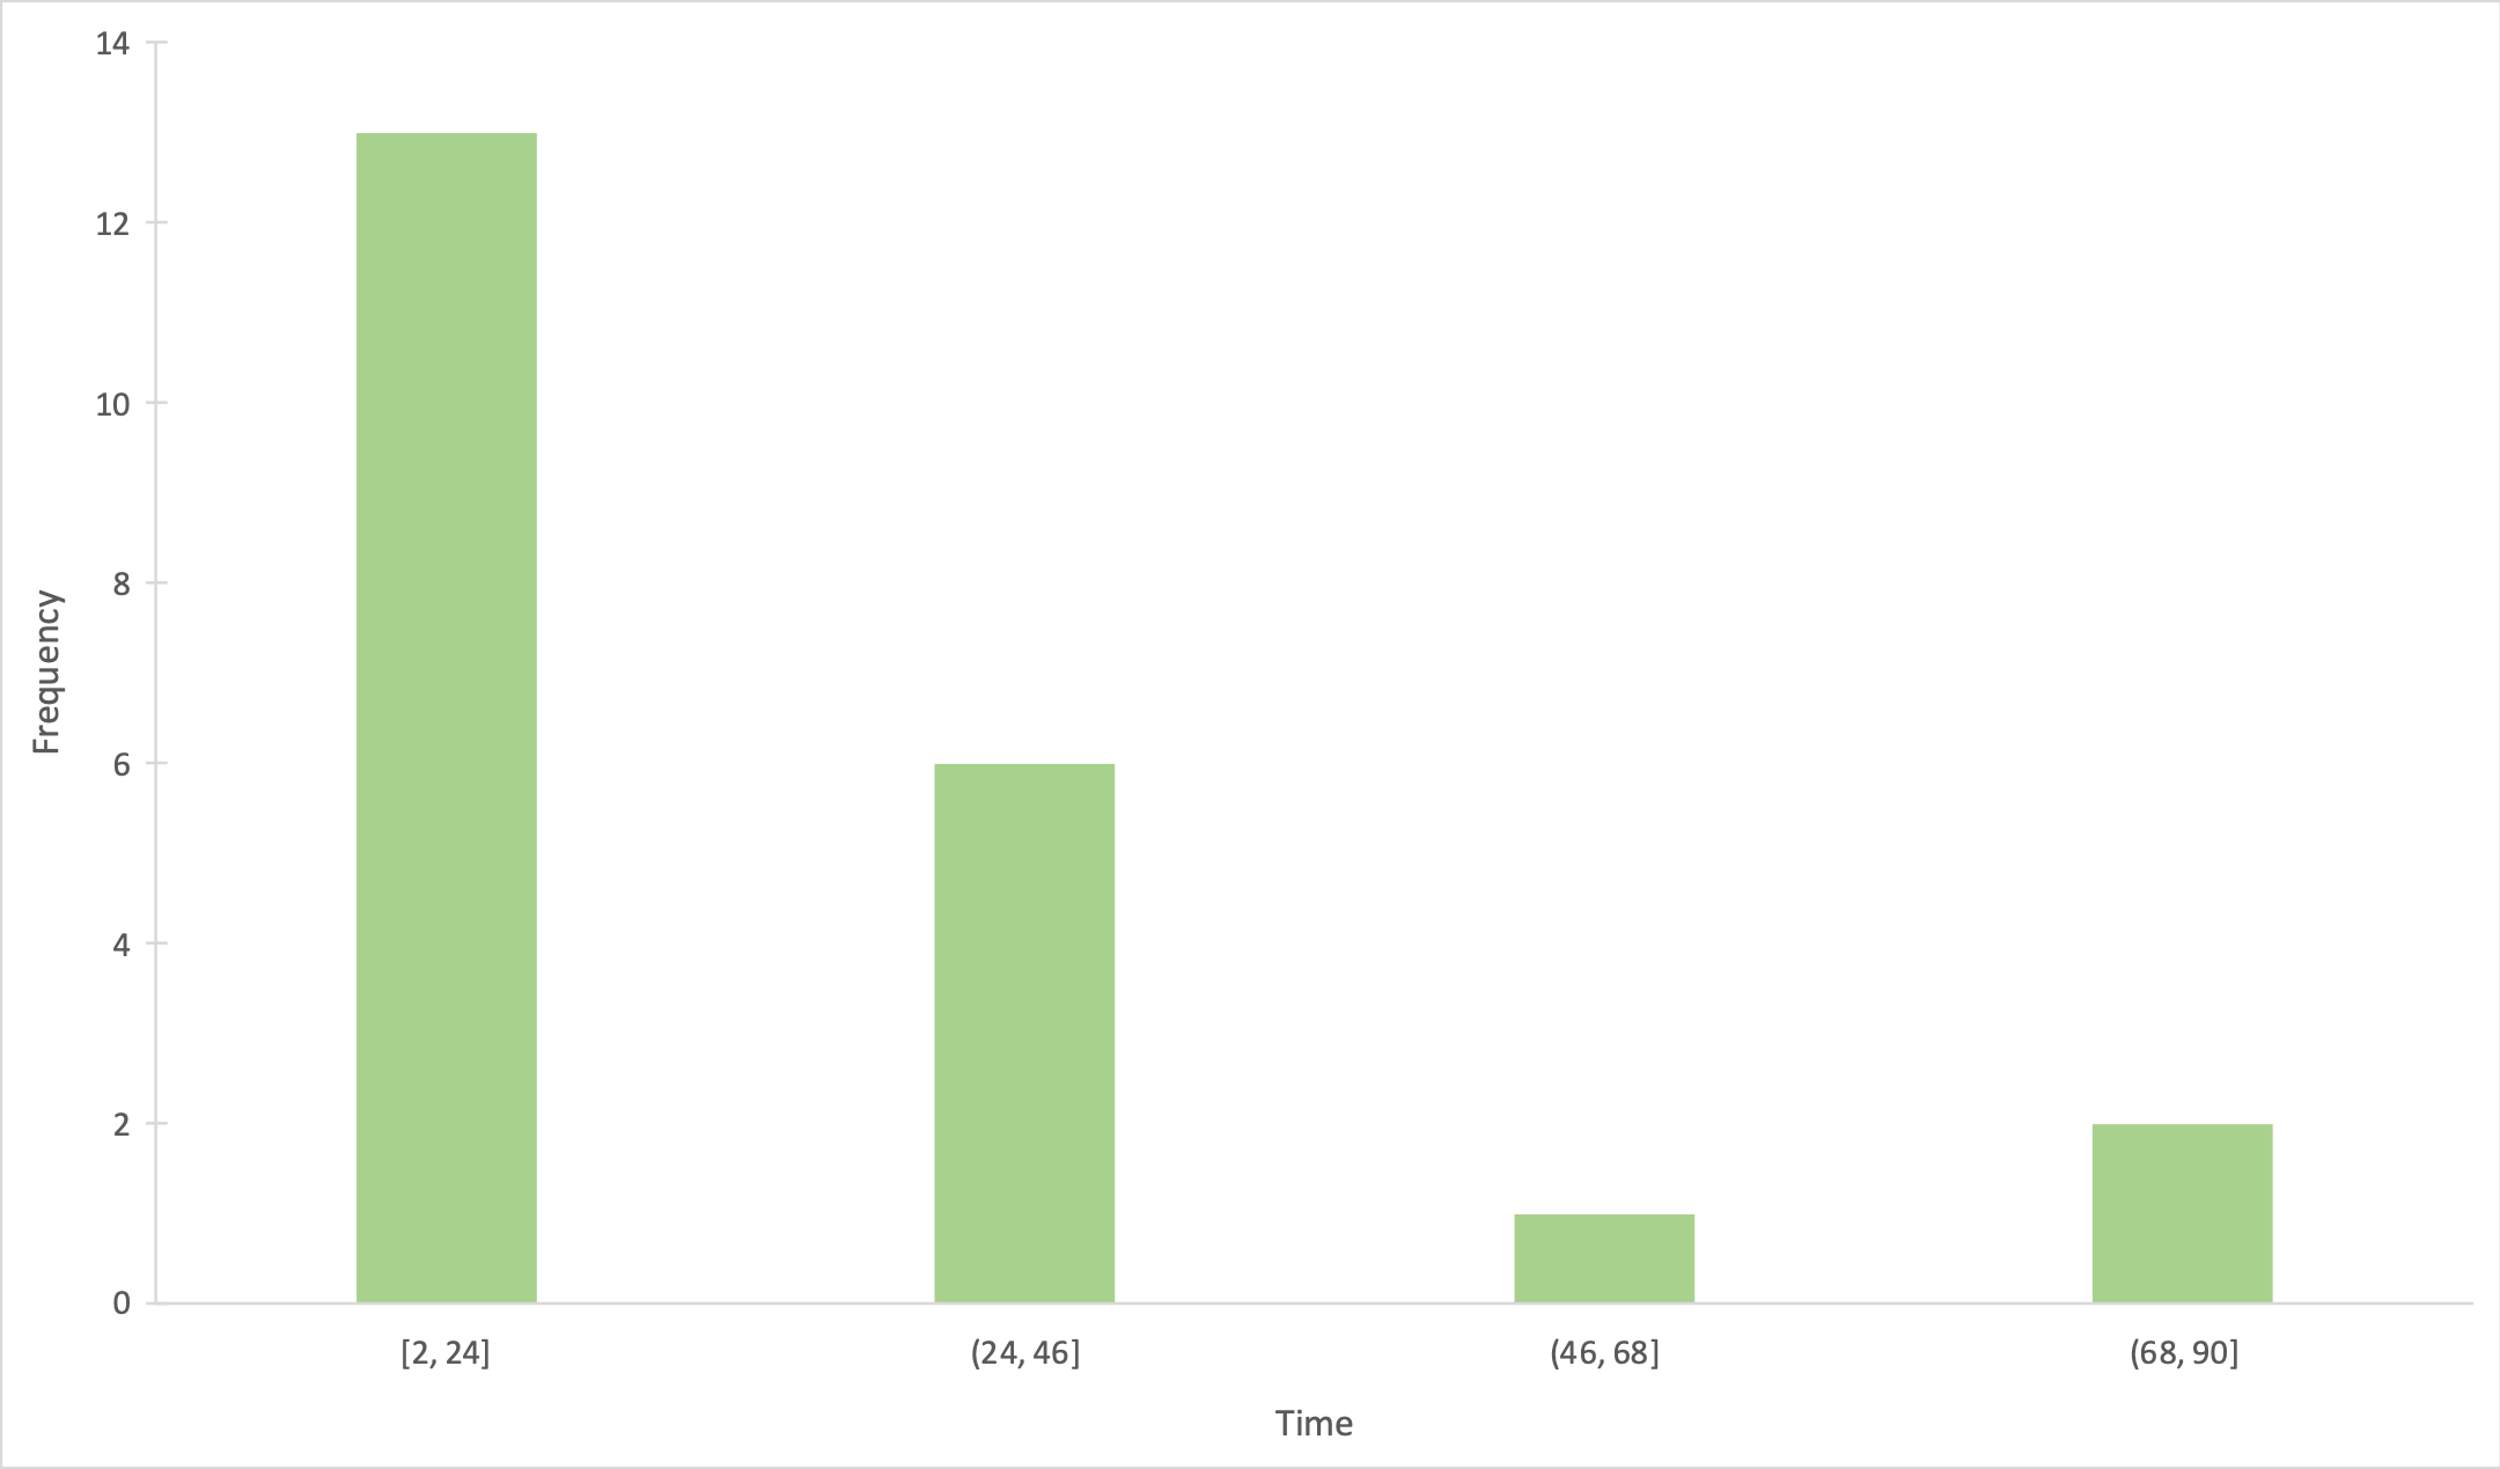
Table 1 below shows the primary data collected from the sample survey. Columns #2 and #4 contain information about the time it took each of the 22 respondents to get to work. This data was visualized in the form of a histogram shown in Figure 1: this allows a clear assessment of the significant difference between the existing values. The choice of the histogram itself for visualization was motivated by the desire to visualize the data, demonstrate the heterogeneity of the sample, and superficially assess which time segments were most popular with respondents. It is easy to see that most of the participants spent from 2 to 24 minutes on the way to work.
Table 1: Primary data
Data Presentation
Data Summary
An analysis using descriptive statistics was conducted for the primary data collected. The results showed that the mean travel time to work was 26.68 minutes, with the standard deviation of the sample being 23.06. This implies that each value in the distribution deviates from the mean by 23.06 minutes on average, indicating a high variance in the data. The median value was 19.5, indicating that exactly half of the respondents needed less time to get to work. Respondents most frequently (N = 3) cited a time of ten minutes, which was the fashion for the distribution.
Reference
McCombes, S. (2022). Sampling methods | types, techniques & examples. Scribbr. Web.