Executive summary
In project evaluation, the following tools can be used to aid managers in project financing decision making: Net present value, Internal rate of return including modified internal rate of return and Payback period including modified payback. The project evaluation the following criteria can be used in deciding whether to finance a project or not:
- Positive net present value. A zero NPV means just preserving the status quo which is not the objective of a for profit organization
- An IRR higher or equal to the cost of capital
- Environmental and societal consideration even if project has a positive NPV and an IRR higher than the required rate of return
The company can adopt the following procedures in analyzing alternative projects:
- “Define the problem” (Anthony, Hawkins & Merchant 2003, p. 877). Is it a make or buy decision? A replacement project or an expansion?
- “Select possible alternative solutions” (Anthony, Hawkins & Merchant 2003, p. 877).
- “For each of the selected alternative, measure and evaluate those consequences that can be expressed in quantitative terms” (Anthony, Hawkins & Merchant 2003, p. 872).
- “Identify those consequences that cannot be expressed in quantitative terms and evaluate them against each other and against the measured consequences” (Anthony, Hawkins & Merchant 2003, p. 877).
- “Reach a decision” (Anthony, Hawkins & Merchant 2003, p. 877).
Given that the IRR and PBP for the projects to be 12 per cent and 6 years for new market or product, 10 per cent and 5 years for market or product extension, 8 per cent and 4 years for efficiency improvement. The company is still better off allocating a portion of its financial resources to following projects, efficient-water treatment at four plants for 6 million, market expansion southwards and eastwards at 30 million each and project 4. The project 11 that acquisition of a leading schnapps brand and associated facilities is rejected because of capital rationing, it requires 60 million while the amount remaining is 54 million. Given the amount then the project 9 and 10 are taken. The IRR and Pay back period criteria as pointed out by the company, however, must be evaluated as to its accuracy. The cost of capital estimation is a very important decision since it can impact all the criteria in evaluating the project: a higher cost of capital means lower present value of the cash flows (excluding investment) generated by the project; and a higher benchmark to be compared with the IRR – the smaller the gap between IRR and the cost of capital, the higher is the chance of that project being rejected.
In evaluating the proposal of the company might also want to use IRR as a criterion. That is if the project has a required rate, then it is better of financing it. Although several finance practitioners have pointed out that sometimes IRR and PBP shows conflicting result, IRR prevails because of time value of money. Indeed any one of the two would serve the purpose” (2004, p. 1643). These sometimes conflicting results, however, is due to the fact that IRR and PBP “have intrinsic differences between one another. The IRR is a financial indicator and the PBP is an economic indicator of a capital investment.
After evaluating using quantitative then comes in qualitative Phase in Project budgeting. When project passes through the quantitative analysis test it has to be further evaluated in terms of qualitative factors. Qualitative factors are those which will have an effect on project but impossible to evaluate accurately in monetary terms. In the case the factors which will be considered will include the following; (Ghetti A. 2008):
- The societal effect of an increase or decrease in employees’ number.
- The positive and negative government political attitude towards project.
- Strategic consequences of conception scarce low materials.
- Positive or negative relationship with labor union about project.
- The possible legal difficulties possible to the use of patents, copy rights, brand names.
- Impacts on the firms image if the project is socially questionable.
The above factors should be factored in project. To enable project address them adequately to be certain of meeting at ultimate objectives.
These projects will be ranked as follows
The projects taken should include
Discussion
In this company there are many constraints among them is capital rationing where the budget for all projects is Euro 120 million. The projects that have meet the acceptable criteria are worth euro 202.5 million, projects worth 112.5million were taken but two crucial were left out because of capital rationing. Capital rationing can be defined as constrains in resources regardless of cost. Capital rationing limits some qualitative factors to be considered when selecting a project. Some viable projects are rejected because of this constrains. In this case capital rationing is one period rationing therefore some projects can be postponed.
In evaluating whether to finance a project or not, the pay back period and the internal rate of return of that project were used. Hence, if the project’s pay back period positive, then the company is better off financing that project and if the internal rate of return or IRR is equal or greater than the company’s benchmark, then the company is really better off financing such project. This project evaluation is necessary and if done incorrectly might mean the financial failure of the organization since “investment policy directly affects company value” (Cohen & Yagil 2007, p. 60). Furthermore, capital budgeting or project evaluation “is one of the most important decisions that face the financial manager. Prior studies spanning the past four decades show financial managers prefer methods such as internal rate of return or non-discounted payback models over net present value” (Ryan & Ryan 2002, p. 355).
Internal rate of return or IRR of a “cash-flow stream is the discount rate at which its pay back periods 0” (Johnstone 2008, p. 78). This means that when using the IRR as the discount rate the present value of the cash flows generated by the project and the initial capital investment for that project are equal. Hence, the 50 per cent IRR of the project 6, means given a return of 50 per cent is “equivalent to a bank account with effective compound interest rate [50 per cent] accruing against both positive and negative balances” (Johnstone 2008, p. 87). Each method is heighted below and its effects;
Payback Method
This method measures the length of time it will take for a business to recover the investment made. The measure uses the initial cash investment made and the average annual net cash flow. Dividing the former by the latter, the result is a number that represents the cash payback period in number of years. The formula is:
Cash Payback Period = Capital Investment
Average Annual Net Cash Flow
It is normal to average the annual cash flow since it is usual to see that cash flows are not constant through the period of the active performance of the capital assets obtained through the investment made.
The shorter the payback period the sooner the company recovers its cash investment. However, the adequacy of the payback period is dependant on the perceptions of the firm, the type of industry or service, and the macro and micro economic conditions. The payback period is usually considered viable if it is between 2 and 3 years. In some projects, in the initial period the cash flows fluctuate vastly and may even be negative at the start. In such cases, the cumulative net annual cash flow helps determine the time for recovery of the investment.
This method suffers from the limitation that it does not factor the differences in cash flows due to their timing or the time required for execution of the project. For example, two projects may require the same investment and have the same payback period, but the timing of the cash flows may be quite different. In such a case, the project that yields quicker net cash flows is preferable over the other.
Net present value
This method considers time value for money. It is calculated as shown below.
Net present value = present value of cash inflows – net investments
The criteria for accepting rejecting the project is if NPV ≥ 0 accept the project otherwise reject the project. The project is accepted when the NPV ≥ 0 because it will increase the shareholders wealth.
Internal Rate of Return (IRR)
This method also relies on the concept of calculation of present values. The IRR determines the interest yield of the capital project at which the net present value becomes zero. Returning to the NPV calculation, we note that a discount rate, based on the needed rate of return of the business, determines the present value of future cash flows. In the case of IRR calculations, the reverse is true, the rate is calculated using the net future cash flows and the IRR is the rate at which the discount will bring the net cash flow to zero, i.e. the present value of the net cash flows and the investment required are the same. Where the IRR is greater than the expected return or the cost of funds the project is financially viable and projects with higher IRR are more viable ( Ghetti A. 2008). Therefore, internal rate of return is the rate of discount that causes the present value of cash inflows to be equal to the net investment value of the project that is the rate which produces 0 net present values (McLaney E., (2003). The criteria for accepting and checking the project is that internal rate of return ≥ cost of capital the project is accepted otherwise the project is subject to rejection. Calculation of the IRR requires two steps. The first step is to calculate the internal rate of return factor using the formula (Westerfield R., Jaffe, and Jordan ,2007):- This can be summarized as follows:
- Annuity: – calculate the payback period of the project and Use the present value annuity factor table find the factor closest to the payback period. This could produce internal rate of return.
- For mixed stream of cash flows:- Calculate the average annual cash flow to get fake annuity and divide by average annual cash flow into initial net investment in order to get a fake pay back period.
- Simpler method is to use spreadsheet software such as Microsoft Excel that allows direct calculation of the IRR from a table of projected cash flows.
Sensitivity analysis and expected value
When evaluating projects with different risks probability assigning is best alternative. Probabilities are used and they provide a clear answer as compared to sensitivity analysis of risk. Therefore assigning probabilities to assess risk is more accurate. Probabilities provide an expected value of a figure which is a measure of accept / reject criteria for the project. It gives a weighted average internal rate of returns where the weights used are probabilities of various chances. It is more objective way of estimating risk. However when the project has different lives and of different sizes sensitivity analysis plays an important role. Sensitivity measures how sensitive a factor is to changes.
Recommendation
The procedures that are used by the company are good but they should be improved to reduce dependency on complicated formulas in estimating the internal rate of return. The probabilities that are used should be specific to specific internal rate of return. They have a wide range of internal rate of return to choose from which creates the urgency problem in the cost of capital.
Agency problem arises when the managers become subjective to the methods or to the decisions of which to accept or reject the project. There should be a proper criteria which will assist in coming to conclusion on the viability of the project or projects that are proposed. In this case there is laid down criteria while using internal rate of return and payback period, the managers may be subjective while choosing the projects. This is because the seven projects are acceptable. Therefore the criteria proposed may have also agency problems. Therefore the management for the company should come up with ways of evaluating the project to ensure there is dependency on the manager’s discretion on which project to choose.
Section D
Windfall tax has many advantages and disadvantages. Windfall tax is a tax on the excess profit of company of certain industry with the aim of meeting long term and short term financial needs of a country. It can be said to have some advantages; one of the advantage of windfall tax is that helps the government to raise short term finance to finance some activities. This advantage will become a disadvantage to the economy especially at this time of global financial crisis because businessmen at the energy sector will pass on the tax to the consumer and accelerating inflation of prices. It is usually in the energy industry where this tax targets. Industry players will pass on the gas and oil price taxes to the people and this will affect consumption and production. Another disadvantage is that industry players may create artificial shortage of that gas so that they may increase prices and thus increase inflation to the economy to recover the tax.
The government may think that windfall tax will raise funds for short term financial needs but it may slow down economic growth by discouraging importation and consumption as well as production since the prices will be high and this is the one of the worst effect of windfall tax. It will also discourage companies which are in the business of oil exploration or intend to be in that business from investment. Organization behavior is also affected by windfall tax through affecting the culture i.e. how things are done.
Firms will make losses especially if the price of raw materials goes below what was intended to be taxed. This will have one of the worst effect of discouraging investment among the energy industry players and this will reduce employment creation and Economic growth. This windfall tax which is only levied only once ensures that the companies in the oil industry to pay the taxes.
Apart the from the disadvantages of windfall tax, it be used to control carbon emissions by taxing oil companies at that are producing product with high levels of carbon. Another problem of windfall tax is that once they is windfall of profit it is imposed, however when there is windfall of losses the government does not come in to save the same industry players. It may cause industry players to come up with some unnecessary expenses that are aimed at avoiding to pay tax. Therefore this tax acts a control measure.
This tax system promotes fairness and ensures that the right amount of tax is paid by ensuring excess profits are taxed. No other taxes unrelated to income need to be paid for the windfall profits. The taxes are accurately calculated according to excess income only. This also ensures that every company is treated equally by not allowing some companies enjoy extra profits. It reduces economic inequality is among all companies of the country.
The tax is easier to manage because it is imposed on past profits and on already audited financial statements. It requires few personnel to correct the tax from the target corporations. It also taxed on the companies as lump sum to the company therefore the issue of the company been asked to re-audit their books becomes unnecessary. It will look like it is very expensive to the side of the company because it will be paid as lump sum but the good thing is that it redistribute the profit of a company.
When I talk of equity/fairness I mean equitable distribution of wealth. The tax payer who is a company making windfall profit is able to contribute his fair share to the cost of government management. In principle equity means that the company pays the tax has much as he benefits and it is through this benefit accrued that a company acquires the ability to pay tax. Windfall tax will not imposed on companies which not be able to pay but imposed on companies that will be able to pay. In essence a company that makes a abnormal profit will charged the tax without sacrificing the companies that are making losses at the time w hen there is windfall profit while others are making losses. For example the current financial crisis , a company can be making losses while others will making profits. If a company is making profits it is benefiting more than others Take the example below where equity has been described for two companies.
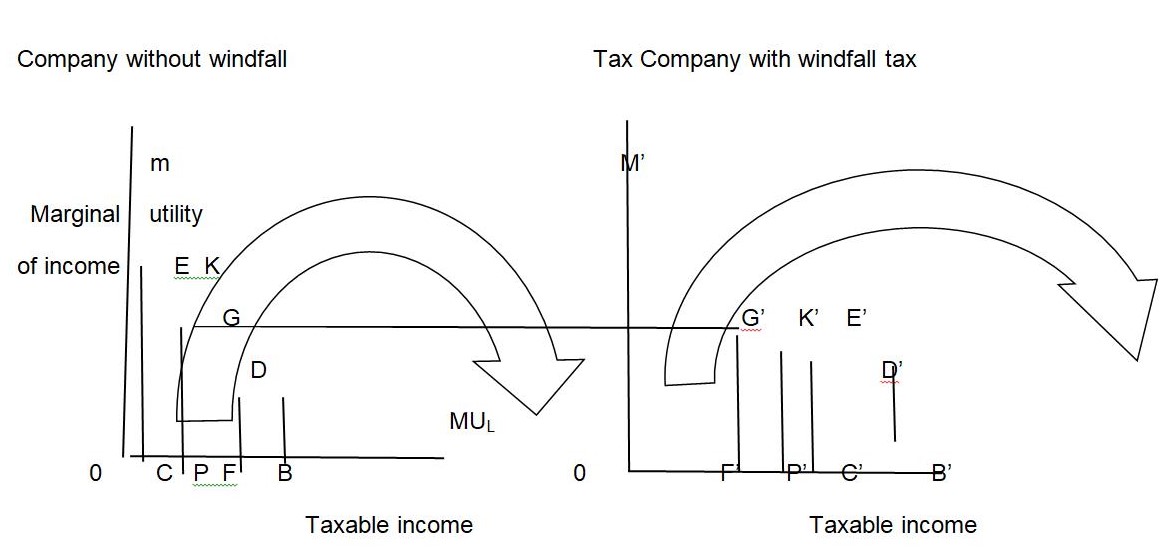
From the graphs above it will narrated as follows:
The how equitable is windfall tax depends on both the shape of the income utility schedule and equity of sacrifice of the government. The graph may be interpreted to mean equal absolute, equal proportional, or equal marginal sacrifice. Where the diagrams pertains to no windfall tax and the right to windfall tax company.MU and MU’ are the respective marginal utility of the income schedules which are identical and assumed to decline at a decreasing rate. No windfall tax income before tax is OB while that for windfall is OB’. The total utilities derived by the two are OBDM and OB”D”M”, respectively. If a given revenue T is to be drawn from the two, how will it be allocated.
Absolute Sacrifice beginning with the equal absolute sacrifice rule, no windfall tax, with income OB, pays CB, while H, with income OB’, pays C’B’, where CB+CBDE while the loss to with windfall tax equals C’ B’ D’, and T is distributed such that CBDE= C’B’D’E’.
If the MU schedule were constantly, equal absolute sacrifice would require tax liabilities to be the same for all incomes. Equal sacrifice would call for a head tax. But with a declining MU schedule tax liability must rise with income. This much is clear, but it does not follow that a windfall tax will be called for. As may be shown mathematically, the required tax distribution will depending on whether the elasticity of the marginal income utility with respect to income is greater than, equal to or less than unity. While it seems reasonable to assume that the MU schedule falls, there is non intuitive about its rate of decline. Thus there is no ready basis on which to conclude whether equal absolute sacrifice calls for progression, not to speak of the proper degree of progression.
Proportion sacrifice if the tax burden is distributed in line with equal proportional sacrificial will pay PB and with windfall tax will pay P’B’ with PB+P’B’ again equal to T. the tax is divided between the two so that the fraction of pretax utility lost for without windfall tax is the same as that for with windfall tax. It is evident that a constant MU schedule will call for proportional taxation. It can also be seen that a declining but straight- line MU schedule calls for progression, but generalization become difficult if the MU schedule falls at a decreasing rate, as is usually assumed. The result in any particular case depends on the level and slope of the MU schedule, as well as particular case on the initial distribution of income and the amount of revenue that is to be raised.
Marginal sacrifice under the equal marginal sacrifice rule, without windfall tax, pays FB and with windfall tax pays F’B’, where FB+F’B’ is the required revenue T. the marginal sacrifice is the same, since FG=F’G’. At the same time, the total sacrifice for both is minimized. After tax incomes are equalized at OF=O’F’. if the marginal utility of income were constant, the distribution of the tax bill under equal marginal sacrifice would be indeterminate. Any distribution drawing at least some small amount from all taxpayers would meet the requirement. Given a declining Mu schedule, equal marginal sacrifice calls for “maximum progression”, i.e., the leveling down of income from the top until the required revenue is obtained. The rate of decline does not matter in this case. The principle of equal marginal sacrifice as applied leaves the taxpayers with the same income. It also results in least total sacrifice for both with windfall tax and without windfall tax combined. The same result is obtained whether we use an equal marginal, or a least toatal, sacrifice rule. But suppose the revenue requirement is les than the excess of there with over without windfall tax income. Here, equal marginal sacrifice cannot be achieved and the result must be stated in terms of least total sacrifice. To achieve least total sacrifice, the tax is applied so as to loop off incomes from the top down, leaving all those who pay tax with equal marginal sacrifice, but not necessarily including all individuals in the taxpaying group.
Social obligations are one of the main reasons that taxes are collected. The taxes collected are used only for public expenditure like infrastructure, defense, health and education therefore this tax helps the government achieve these. The economy needs to be stable and growth needs to be ensured. A windfall tax rate will help growth as the taxes are lower and more money is left for investment and expenditure. The economies are increasingly becoming international. The tax structure needs to be competitive with the other nations.
The maximum impact of the windfall tax system will be on the individual that is because the amount paid as taxes will charged on the consumers. The poor who live below the poverty line will have to get goods and services at a higher price.
The other main arguments for the system are simplicity, equity and meeting of socio-economic obligations. The system is also more efficient in the sense that it helps the economy perform better. Firms that pay taxes may pass on these taxes to the customers or suppliers. Hence, the taxes paid by the firm may be in accordance with profits. Those may be paid by the consumers in addition to the income taxes already payable. According to this argument there should be a windfall tax on extra income and no other taxes tax when the industry is no making windfall taxes as a whole. This will also lead to different consumption patterns which will also lead to different taxes from consumers of windfall taxed products. This will ensure a fair income tax. The simplicity of this system also enables easy calculation, collection and reporting.
After research it becomes apparent that there is a long way to go before windfall taxes accurately reflect the true economic picture. The windfall tax system is much fairer than the other tax structure as the poor have benefit of gaining through discouraged overcharging by industry players. The other system has too many tax induced distortions which fails to consider windfall taxes as a social mischief. The adjusted gross income calculation is way too complex and needs to be revised completely. The windfall tax system protects the poor and taxes the middle class and the wealthy fairly and equally. As the income from only activities that are making excess profits is taxed equally the system becomes really simple. The system eliminates the many adjustments resulting from encouraging and discouraging different activities that reduce consumption.
The money collected from the tax is used for basic social necessities and social security. The tax should be used to support activities that require charity. Taxing consumption to mange social behavior is not valid as the taxpayer has already paid a tax on the income.
In conclusion, I can say that the future is bright if countries unanimously agree to radically and introduce windfall to discourage multinationals from making unnecessary profits. The governments have to fulfill socio-economic obligations and enable equitable redistribution of income. It should also ensure overall development. The windfall tax is simple, fair and efficient. The perspectives will include the influences on the firms in association with the individuals. Finally, the money collected has to be spent where it is needed the most.
Works Cited
- Anthony, R., Hawkins, D. & Merchant, K. 2003, Accounting: Texts and Cases, 11th edn, McGraw Hill, Boston.
- Bosch, M., Montllor-Serrats, J., & Tarrazon, M. 2007, ‘NPV as a Function of the IRR: The Value Drivers of Investment Projects’. Journal of Applied Finance, vol. 17, no. 2, pp. 41-45.
- Cohen, G. & Yagil, J. 2007, ‘A Multinational Survey of Corporate Financial Policies’, Journal of Applied Finance, vol. 17, no. 1, pp. 57-69.
- Fischer D. E.and Jordan R.J. (2006) Security analysis and Portfolio management, Prentice-Hall, India.
- Ghetti A. (2008); Terrific introduction to financial management; Amazon
- Johnstone, D. 2008, ‘What Does an IRR (or Two) Mean?’, Journal of Economic Education, vo. 39, no. 1, pp. 78-87.
- Karathanassis, G. 2004, ‘Re-Examination of the Reinvestment Rate Assumptions’, Managerial Finance, vol. 30, no. 10, pp. 63.
- McLaney E., (2003; Business finance theory and practice; Prentice Hall
- Ryan, P. & Ryan, G. 2002, ‘Capital budgeting practices of the Fortune 1000: How have things changed?’, Journal of Business and Management, vol. 8, no. 4, pp. 355-364.
- Singh, S. & Gaur, P. 2004, ‘How Close are NPVI and IRR as Criteria for Project Choice in Real Life?’, Finance India, vol. 18, n0. 4, pp. 1643-1650.
- Tang, S. & Tang, H. 2003, ‘The variable financial indicator IRR and the constant economic indicator NPV’, The Engineering Economist, vol. 48, no. 1, pp. 69-78.
- Westerfield R., Jaffe, and Jordan (2007); Corporate finance core principles and applications by McGraw-Hill. ISBN-13: 978-0-07-353059-8/ISBN-10:0-07-353059-X
Appendix
Workings
Project 1.
The project takes 2 years and its IRR can be calculated. The project has a 5.8years payback period since it can no cover for its cost. It generates 11.6 million and uses 33 million.
Average net cash inflows = 11.6/2 = 5.8
Payback period (PBP) = 33million/5.8 = 5.6896years
IRR from tables using 5.6897at 2 years = it is less than 1%
Project 2
This project also results into cash flows that are lower than the initial investment. It means neither IRR nor PBP will be applicable. It uses 45 million and receives 35.6 million.
Average annual cash inflows 35.6/10 = 3.56 million
PBP = 45 million / 3.56 million =12.640 years
IRR from tables using 12.640 at 10 years = it is less than 1%
Project 3
The payback period of the project is 15million/2.25million = 6.667 years
Internal rate of return using tables of 3 decimal points at 10years is approximately 8% taking 6.667 as a present value interest factor of annuity.
Project 4
The project has enough cash flows to support further expansion.
Project 5
The pay back period is 21million / 0.15million = 140 years
IRR at infinity is less than 1%
Project 6
The present value of the project pay back periodis 15million x PVIF4years, 10.6%.
13.56 million
Net annual cash flows = 15m/4 = 3.75million
PBP = 6/3.75 million = 1.6 YEARS
IRR from tables = 50%
Project 7
Average annual cash flows =56.3 million/ 10 years = 5.63 million
PBP = 30million / 5.63 million = 5.3286 years
IRR at 10years using 5.3286 is 14%
Project 8
Average annual cash flows =48.8 million/ 10 years = 4.88 million
PBP = 30million /4.88 million= 6.1475
IRR at 10years using 6.1475 is 10%
Project 9
Assumption the gains will be equivalent to the current share of profits 20% of 56 million
11.2 million. Then the payback period is calculated as
Capital investment =27 million
PBP = 27million / 11.2 million= 2.4107 years
IRR at 4 years using tables at 9.6429 is less than 24%
Project 10
Assumption the gains will be equivalent to the 8 million annually. Then the payback period is calculated as
Capital investment =22.5 million
PBP = 22.5 million / 8 million = 2.8125
IRR at 3 years using 2.8125 is 16%
Project 11
Assumption the gains will be equivalent to the16.5 million annually. Then the payback period is calculated as
Capital investment =60 million
PBP = 60 million / 16.5 million= 3.6364
IRR at 6 years using 3.6364 is 16%