Introduction
For many years a financial report is no longer about the performance of the previous periods only, it is expected to reflect the value of the company much more than ever. After some decades of creating value on the balance sheet as a lucrative instrument to fund all sorts of new businesses, we learned and concluded that the creativity to do so should be limited. Today’s Financial report is expected to be reliable in a definition of Market Consistent Embedded Value, Value at Risk and clear capital requirements being detailed. To make this change happening international regulatory requirements are defined to push the implementation. Bringing Risk and Finance data together these two factors will potentially have much more influence on the annual performance of a company then the actual operational results. The increased importance to get these risk and finance figures right has become much more of an domain of interest on its own for analysts and shareholders then before. The real challenge for corporate companies to get these figures right has two main pillars. First, and as important as the other, the calculation methodology applied on positions and different risk types across markets to be transparently consolidated into a total position. Second is the controlled way of reliable and certified data fed into the calculation methodology.
SecondFLoor believes the implementation of this second pillar is much more of an ART then only a technical implementation of standard applications and common technology. We believe to get these figures right a strong interaction between business representatives and different sorts of data is the key to successfully feeding certified data into your calculation methodology. We believe we need to integrate corporate multiple sources, in favor of replacing them, which creates new knowledge intense implementation risks. We believe our business understanding and strong IT delivery capabilities do contribute to a reliable, transparently and auditable annual report, build up with underlying information for a CRO and CFO to take responsibility for the end result, knowing in today’s world personal liability increases with each judge ruling.
Usage example
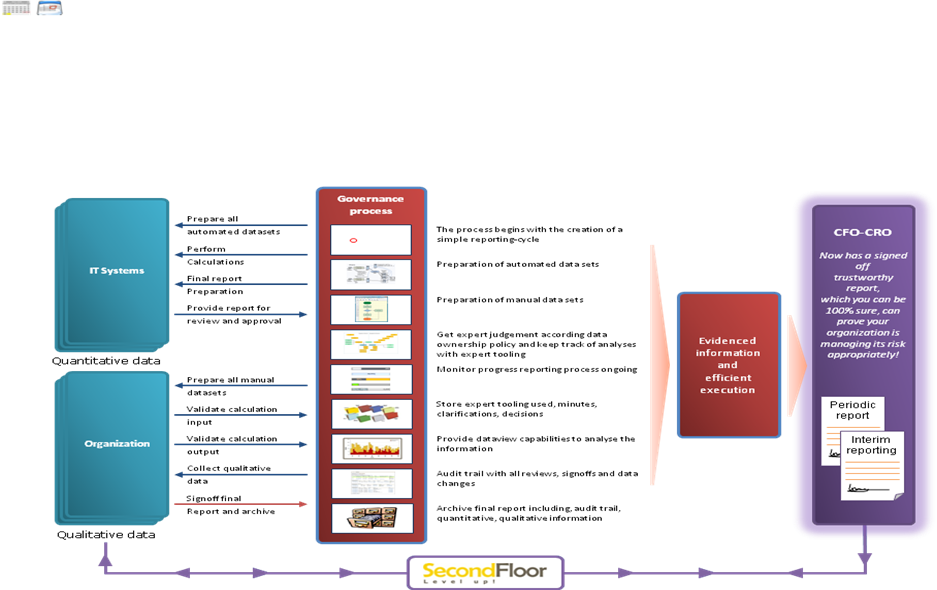
The following illustrates how eFrame can be used to create a solo QRT reporting cycle. This process progresses through the organization in a way both simple and repeatable. To begin with, of the key individuals involved in the process, the CRO is most pivotal; the position has the responsibility of publishing the determined figures, and also has the final word in signing off on both QRT report and reporting cycle. Beyond this role, the Actuarial Analyst sets up the reporting cycle, and the Head of Actuaries reviews and approves the work, using the 4-eye principle. These responsibilities understood and in place, then, the CRO begins the entire reporting cycle when he is comfortable with prior results. When these are satisfactory, the CRO will typically employ the previous settings to facilitate the new report process. These consist of the hierarchy, the assignment matrix, and the dataset.
The process is then underway, and the user responsible for the QRT reporting sets up the new reporting cycle, with the users responsible for data delivery acting as group analyst. My own role is that of Actuarial Analyst, and I am in this demo responsible for doing the QRT reporting events for two nodes: the EST in the USA, and the NL. The users responsible for data delivery first logs in and receives a notification. He then checks the empty datasets; performs a dependencies check; does a visual check on input datasets; and verifies the work by using the appropriate button. Following this, I would expect to see the QRT templates, the QIS5 input templates, the interim or direct date uploads, the QIS5 calculation, the solo QRT, and the QRT balance sheet report. I then activate the dataset and, under “reporting event”, exhibit the completeness report (which will reveal missing data), run the QRT standard formula, and check that the correct hierarchy for legal entities is being used. I then activate the reporting event and submit the cycle for approval.
A new step is introduced with the data owner, a C-level manager and potential head of actuaries. This individual reviews the submitted cycle upon notification of it and, in giving further approval, copies the previous reporting cycle data across to the new cycle. The next step requires the users responsible for data delivery to perform the final tasks of the QRT calculations, upon being notified of this readiness. This translates to the users responsible for data delivery executing the QIS5, which is the input for the other templates. He first shows that direct input is approved as active, and then moves to the system prepared earlier. The users responsible for data delivery then executes the final QRT solo, runs the report and reviews the data, and submits the entire reporting event to the data owner who, upon notification, performs a comparison of the QRT solo data. When the data owner signs off on the reporting cycle, it then moves on to the reporter, which will now have an updated dashboard. This is now the stage when the CRO reviews everything done prior to this point, and determines if all the evidencing warrants disclosing of the reporting cycle. When this is signed off on, the cycle returns to the reporter, who reviews the reporting event, downloads it, and then sends it on to the appropriate destination(s) (auditor, regulation office, etc.). After this, the reporting event is closed.
Lastly, in regard to the demo’s utility, the features, steps, and functionality should be noted once more. All necessary components are in place, including database and manual uploads; the ability to compare work across reporting events, cycles, and environments; the assignment matrix; the hierarchy upload; and extracted date. Finally, there is the completeness report followed by the actual event download.
eFrame
To ensure these processes can be performed in a governed, timely process, eFrame’s core functionalities are focused on the following elements, each described in a separate chapter.
- Governance
- Reporting Context
- Workflow
- Data management
- Calculation
- Connectivity
- Reporting
Governance
Auditable reporting processes are about collecting data, managing data responsibilities and the possibility to create reports, both standard reports as well as ad hoc, unpredictable reports. Key in this process is robust governance. To assure this, all functionalities eFrame provides are centered around this.
The most important aspects in guarding the process are
- Auditability of all actions and data.
- Differentiation in user base. Dividing users in roles assures separation of responsibilities.
- The ability to model the process and its governance in a workflow.
- The ability to reproduce results.
Audit logging
To ensure traceability of all data used for a report, all elements of the system are audited by eFrame. This auditing includes keeping track of what user did what when. Besides this, the workflow can be configured to require sign offs on the most important data elements used to create this report.
The signoff procedure covers a number of users all having to agree on a data element. Each signoff can be supplemented with either review comments or documents. Audit reports are available for users easily access this information.
Besides the data elements, all other artifacts can be subjected to this audit process as well, such as the hierarchy, the workflow itself and the data set.
Separation of responsibilities
Part of the sign off process is the separation of responsibilities. Through this, different roles will have different tasks to perform in the application, such as inititating a reporting event, uploading data and creating the reports.
Besides this distinction in tasks, the separation of responsibilities is an important aspect of the auditing. To ensure that all data is correct and validated, multiple signoffs are required. The number of signoffs is configured on the workflow, each requiring a different user to perform it.
Reporting context
Key in every governed reporting process is the ability to add the concept of recurring periods. Each period, the reports need to be generated, and the process to do that must be repeatable and predicable. This concept is strongly represented in eFrame by its reporting cycles.
Reporting cycles
The reporting process is cyclic by nature, every quarter, month, year… reports have to be created and disclosed. eFrame’s reporting cycle models this cyclic nature in periods that follow each other. Each period, the whole workflow is executed, starting with opening the cycle until the final report is approved by all responsible participants.
Following the reporting cycle, eFrame helps the organization in timing the appropriate actions, and keeping track of steps in the process that can be performed in parallel. The result of having these controls is not only a sound process, but very importantly, timely delivery of the required reports. Where the lack of a automated process results in several weeks required to finalize a report, eFrame enables the organization to reduce that time to days after a period has ended. On the other hand, the repetitive nature of the reporting efforts is often lost in data management/reporting tools, eFrame provides this notion of time, and the recurring effort, following the business cycle or the timeframes enforced by a regulator.
Even though the timeframes are guarded in eFrame, flexibility is provided to make sure bottlenecks in the organization can be absorbed. If one data item is delayed, the whole reporting cycle should not fail and the application allows to ‘wait’ for these type of delays. For this, the workflow and reporting cycle are not oriented to physical dates, but to completion of all tasks that need to be executed.
To monitor the progress in the reporting cycle, completion reports are available. These reports show the status of data being delivered and approved. This allows the overall manager of the reporting cycle to early signal potential delays and action them.
Hierarchy
Besides the context of time and periods, every organization needs to build up the reporting in the context of the organization structure. This hierarchical structure is represented in eFrame, and users are connected to the nodes they have acces to. Once this configuration is performed, the model maintainer will configure which hierarchy nodes need to supply which data.
Once the configuration is done, the individual users of the business units start to supply their data, and complete their tasks. To make sure users can make informed decisions on the quality of the data and the signoff of it, reports can be viewed on each level of the hierarchy.
Once all data is present on the nodes that need to supply, eFrame provides functionality to aggregate individual results to create group reports. This aggregation facilitates currency conversion and a range of aggregation functions such as sum, average, maximum and minimum.
The organization structure in itself is of course subject to auditing as well, and is scoped to a reporting cycle. Different environments can thus have different views of the organization, making it possible to facilitate different types of reports, and extensive what-if analyse.
Environments
Consecutive reporting cycles are very useful for format reporting streams, analysts will also want to have the ability to create less formal workstreams, where what-if analysis can be performed, and less strict governance is needed. For this, eFrame is offering environments. Within eFrame, users can create and maintain multiple environments, so formal reporting streams can be separated from each other and from informal reporting streams. These environments will be configured with their own workflows, data set definitions and models. Users can have different rights within different environments.
Archiving
The archiving functionality allow users to archive reporting cycles in an environment. These archives serve two main purposes. Of course they are used to archive data and place the archives in long term storage, but they also allow data from one reporting cycle in an environment to be archived and imported in another environment. This other environment could also be on another installation of the application. Once imported, the analysts can investigate and change data without disturbing the formal reporting process, and thereby avoid the risk of compromising the audit trail and jeopardizing the time lines.
Workflow
The workflow drives all actions in a reporting cycle. The users configure the workflow once, and reuse it every period to complete reporting. The configuration of the workflow is part of the setup and preparation of an environment. To align the workflow within eFrame with the broader workflow definitions in the organization, eFrame provides the functionality to upload a formal workflow definition and link the workflow steps in it to eFrame functions. Once approved, the workflow will control the data collection, model calculation and governance within the active reporting cycle.
Configuration of the workflow
There are two options to configure the workflow. eFrame has the ability to create the workflow in the application by providing a web-based editor.
In addition to using the eFrame toolset, business users may also use their favorite BPM modeling tool (e.g. ARIS or other designers) to design the workflow. The process design is configured in eFrame, where the eFrame process engine will execute the workflow supporting the complex business hierarchy. For example, a user’s role in the process is determined by the position in the hierarchy.
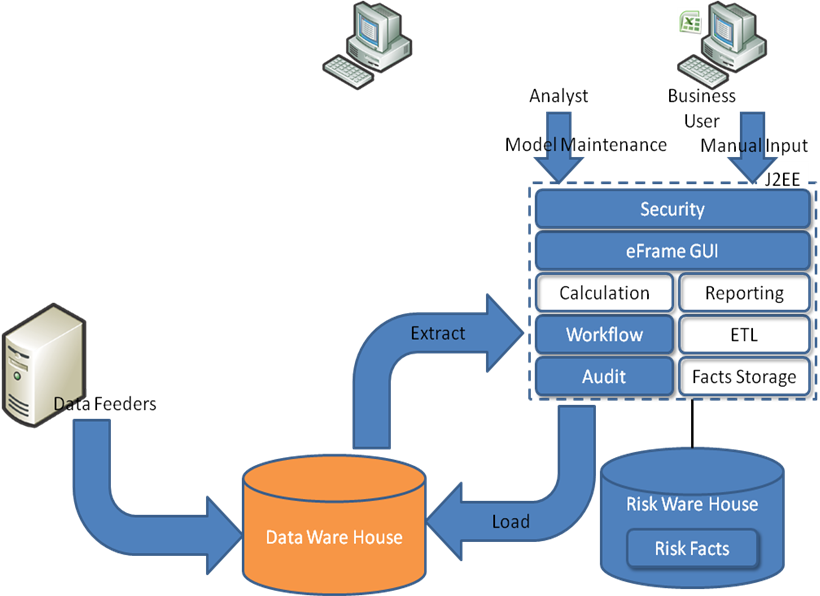
The eFrame process engine drives the end-to-end process: automatically perform steps which do not require manual intervention (e.g. extract data from data-feeders) and assign manual tasks to the different roles (including notifications). A completeness report is available to provide an overview of which tasks have been completed, giving the user a complete overview of the reporting cycle’s progress.
Data management
An invaluable aspect of the reporting process, and the ability to support it, is data management. With strong support for data management, not only can the product collect data from users but also allow them to easier report on them. An important aspect of this is the organization of the data, and how it is stored. With a flexible and extendible model, customers can benefit from existing data repositories by leveraging ETL tooling while still keeping strong control over the audit and governance aspects.
The overall process
The overall process can be divided in 4 steps.
- The configuration of the taxonomy
- Associating meta information with data elements
- Collecting data from users or certified systems
- Populating external databases with reporting data
Step one involves the privileged user to set up the taxonomy based on the data requirements for the reporting model. Key element in this step is to preserve the concept of data elements in a data set. Not only will the system be set up with all individual data elements, it also needs to know what constitutes a data element, so the appropriate governance can be applied. For example, a balance sheet might have 100 data elements (values to collect), however while configuring these 100 elements, a separation needs to be preserved between assets and liabilities since the responsibility for sign off resides with different roles.
Once the data set is configured, and thus all data elements are knowns with all the required values per element, the association of meta information will be set up.
Step two involves the association of meta information to the data elements. Meta information is all information that is added to data provided without it being part of the data itself. A good example is currency. Data received contains monetary values, these values are denoted in a currency, but not part of the actual inputs. In this case, meta information describes the actual currency of the data provided.
There are three levels of meta information that can be configured.
- Meta information that can be derived from system configuration. In the currency example, the hierarchy in eFrame knows the currency of a node, and as a result the system can automatically associate the it once data is received.
- Meta information that can be statically assigned to a data element. An example would be to tag a data element with the value ‘Asset’, so every time data is supplied for this data element, it will be assigned this value.
- Meta information that depends on user input. An example of this type of meta information could be unit of measure. Once a data element is received by the system, the user needs to indicate the units used. The system has a set of allowed values preconfigured, such as ‘nominal’ and ‘millions’ and the user selects the applicable value.
Step 3 is the actual collection of data once the configuration steps are performed. Since the data required is organized in a logical structure, the user who provides the information chooses the method of data delivery. Either manual upload through excel templates, or supplying an ETL script to the system that obtains the information from an external source. If the user provides the data manual with excel templates, the meta information that need selections will be prompted at upload. In case an ETL script is provided, the user makes the required selections when providing the script.
Step 4 consists of the provisioning of contained data into external databases or into Excel models. This step includes performing aggregation, currency conversion, and loading the data into the configured destination. Loading data is performed using a datamapper (for Excel based calculation models) or ETL scripts (for loading into data-warehouses).
Data model
The data model supported caters for structured data storage, in a relational structure. All data elements configured in the system result in data qualifiers configured. All actual data that enters the system has a relation to these qualifiers. The meta information elements are stored separately and link back to the data elements.
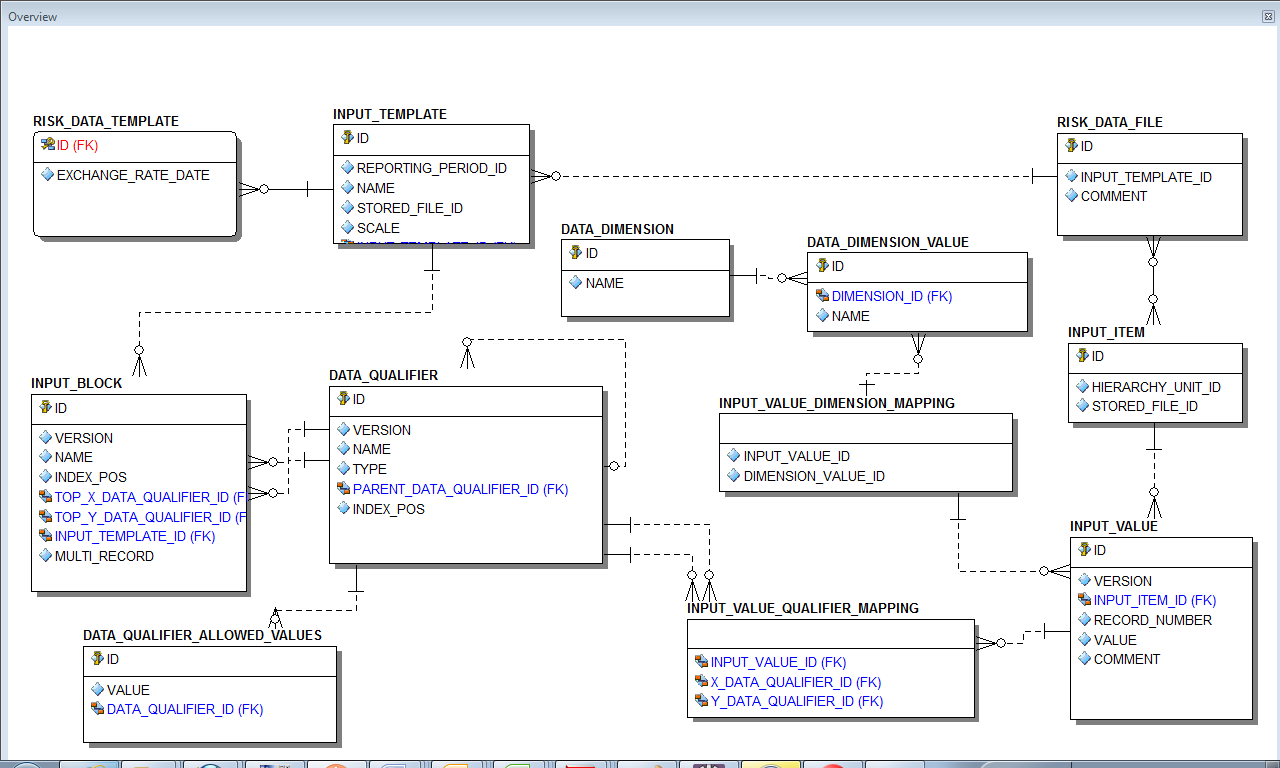
The system supports different dimensions, including the Environment, Reporting Cycle, Business Unit, DataSet, Template Definition, Currency, etc.
Synchronization with existing data ware houses
Key in the datamodel is it relational character, which allow for synchronization with existing data warehouses. Since all data is stored in the model, both the taxonomy of the data the application will collect as well as the actual data, it allows for standard database tools to insert and update model information from external sources. This can save the effort of configuring the taxonomy and allows eFrame to participate easy in a larger modeling effort by taking part of the data requirements, synchronizing model information and feeding back results. The eFrame operational database contains the audit trail of the key modelpoints, while the data ware house contains the ‘raw’ data collected from the various data feeding systems.
Accessibility of collected data
The relational character offers a lot of freedom for the end user to configure reports. This makes the governance more robust because it allows the system to tailor the information used for sign off, not only input data, model results but all combinations of data available through eFrame’s standard report designer. The ETL facilities also allow for loading of results back into any data warehouse.
Data taxonomy
Central in the process and data model described is the data taxonomy supporting a set of models in a reporting stream. This taxonomy is a description of all data needed to populate a model and its results. Setting up such a taxonomy can be a time consuming effort and will easily introduce errors due to the amount of data elements in a typical model. eFrame provides simple means to configure and set up the taxonomy, utilizing it’s abilities to interact with Excel files. This makes it easy not only to set up the structure, but also preserving the concept of data elements within a data set, each with an individual sign off procedure.
To set up the data taxonomy for a model, the model maintainer creates excel templates that follow a predefined structure. These templates are uploaded to eFrame, where they are interpreted and translated in all required database configuration and stored.
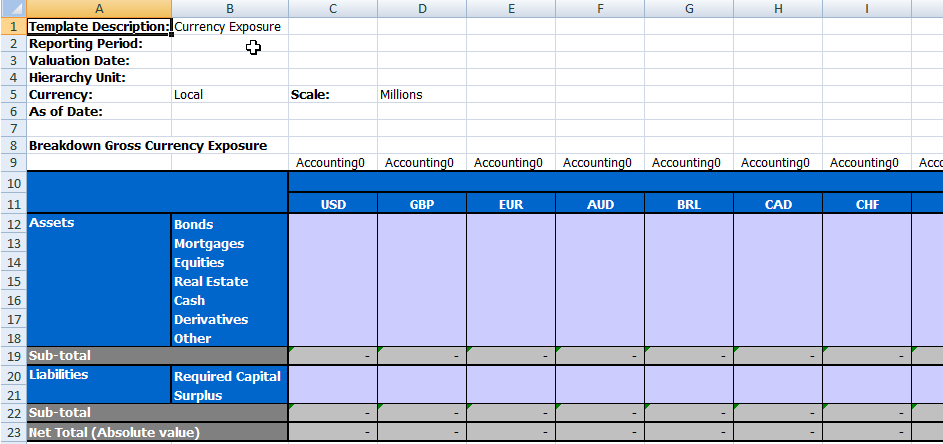
As visualized in this sample, the configuration allows for multiple layers of data qualification. To cater for more control over the expected content, type indication can be added, allowing for validation steps of data supplied. In this example, all values are expected to describe monetary amounts (Accounting) with zero decimals precision.
The templates allow the model maintainer to define the taxonomy on different levels: per file, per sheet, per section and per row/column.
Using existing taxonomy
Since the taxonomy itself is also stored in the eFrame database, the ETL abilities allow to obtain it from an external source and import it directly into eFrame without the need to configure using these excel templates.
Taxonomy maintenance
One of the main advantages of utilizing the taxonomy for all data elements is the ability of model evolution while preserving the ability to monitor result over time.
Once the data requirements for a reporting stream change the taxonomy can be extended to capture these modifications. By adding new qualifiers for a new reporting cycle, the model can be adapted to use this extra information, but does not change the relevance of the existing elements, allowing still to track them over time. In other words, growing or expanding the model is not a new model that has no correlation to a previous version, but is just an expansion and all unchanged elements are truly unchanged.
An additional advantage is that the taxonomy also allows for changes in the governance structure within a model. By rearranging the way qualifiers are associated with data elements in the data set, inputs can be combined, split up or shuffled within one and the same reporting stream, without the need to redefine it as a new reporting stream, thus preserving historical data.
Finally, since the type and unit is also stored for the data, aggregation and currency conversion can be applied to calculate the input for the entire group of a complex business hierarchy.
Data collection
Once the taxonomy is configured and signed off, reporting can start and users can start to provide data to the system. eFrame provides three methods to supply data for a taxonomy. Each user can choose the method that applies best for him/her. For example, a data element might be available in an external source for some users, based on the node in the hierarchy. These users will utilize ETL as data delivery method. Yet other users might not have such external source and might choose to manually provide data to the system for the same data element. Even in the same reporting cycle users can choose to first load with ETL, but if they do not like the results still decide to replace data with a manual upload.
Methods
- Manual upload using excel files as data carrier. The system has the ability to create user templates based on the taxonomy. These input templates will resemble the excel example in Figure 2. The user can download an empty template file, populate it with data and send back to eFrame. This method is ideal for data that is not available in other systems for automatic retrieval, and data that is qualitative of nature. It may also be used to verify/improve the numbers before they are used further up in the process chain.
- Automatic population from external source. Data that is available in an external data source can be extracted and loaded in eFrame by means of executing an ETL script. The ETL script can be designed in a graphical designer and provided to eFrame. The script will function as the data delivery from the user and execute every reporting cycle. Once executed, the user reviews the results and signs them off. To illustrate, an example of graphical ETL construction
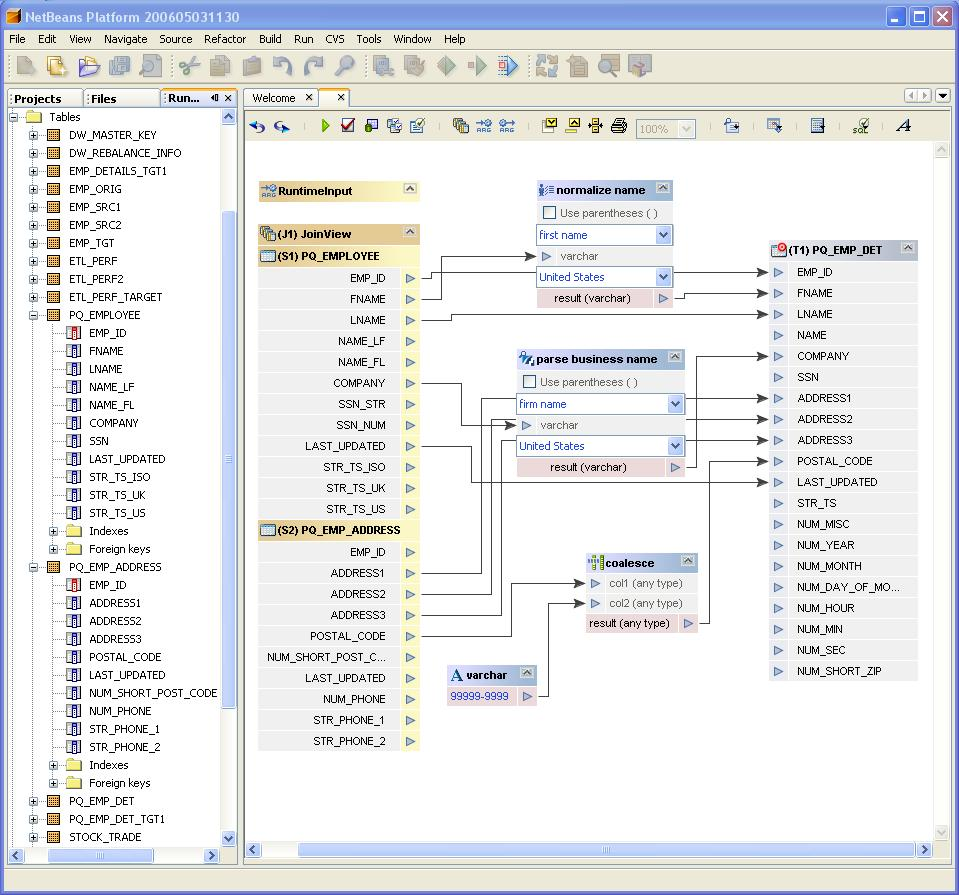
Figure 5. Graphical ETL construction - The third method caters for data collection from sources that are not very standard. eFrame’s architecture allows plugins to be developed that extract data from propriety formats and populate data in the data set.
Meta data
As described, some meta data that will be linked to data needs selection from the user. Depending on the data collection used, eFrame provides different mechanisms to obtain this information.
In case of manual data uploads, the UI will construct an input form where the user chooses the values that apply to the data that is being uploaded. In case of ETL extraction the values are specified when the ETL script is provided to the system. Each time the script is executed, these values are applied to the data resulting from the script.
Calculations
Once all data requirement are configured, and users can provide their data. The system can be set up to perform calculations on this data. The results of the calculations are available to construct reports with. eFrame offers the ability to use existing calculation models in the reporting process, eliminating the need to re-implement for the sake of the tool. Key element is model calculations is adding governance on the model itself, the execution of the model and the results of the model.
The overall process
The overall process can be divided in 3 steps.
- Configure the system to use the model.
- Execute model
- Extract results for further reporting
Step 1 allows the user to associate a calculation model with a dataset. Once the model is provided to the system, input data need to be mapped to it. In many cases, the model will directly obtain the information it needs from the database, utilizing the taxonomy. But if this is not possible, for example if the calculations are performed in an excel workbook, eFrame allows to configure a data mapping, describing how data from input data is to be used in the calculation model. The model will result in data elements, so when configuring the system, all data resulting from the model need to be added to the taxonomy. Taxonomy configuration for the model is the same as it is for input data.
Step 2 is the execution of the calculations. Depending of the configuration of the workflow, this is a manual step or the process is triggered by the workflow. First, data is made available for the model, and the model calculation is triggered.
Step 3 involves the extraction of results and storing them in the eFrame database. The results are linked back to the corresponding elements in the taxonomy. By storing the results back into the datamodel, using the taxonomy, eFrame allows linking models where the output of one model can be combined with more input data to feed into the next calculation.
Supported models
eFrame supports three standard model types and the possibility to develop plugins that interact with others.
The standard model types are:
- Matlab models. Users can create calculations in Matlab and configure them in eFrame.
- AFM models. Actuarial models created in AFM can be added.
- Excel models. For the less complex modeling requirements such as intermediate calculations, excel models can be configured and executed.
Since the costs of re-implementing calculation models are very high, eFrame supports plugins to interact with different models. The plugin follows the pattern of the overall process.
- eFrame triggers the calculation
- The plugin requests input data
- The plugin delegates the execution to an external application
- The plugin feeds results back to eFrame
- eFrame marks the calculation completed and makes the results available to the users for review.
Connectivity
Connectivity with external systems is essential in any reporting process. eFrame exposes API’s for automated interaction with external systems. Besides the ability to use API’s, eFrame provides a plugin mechanism to facilitate interaction with external systems, or interaction with proprietary systems.
API’s for automated interaction with external systems
In order to allow automated interaction with the application, API’s are exposed.
Directory polling for input files
To provide file exchange with external systems, the application provides a directory polling function.
Reporting cycles
This API allows automated processes to maintain reporting cycles. This includes creating them, activation/deactivation and closing of reporting cycles.
Hierarchy
This API allows synchronization of the hierarchy presented in eFrame with one in an external system
Users
This API allows for automated user management, such as adding and removing users, or updating their details and permissions.
Batches
This API makes it possible for automated processes to trigger the execution of batch jobs defined in eFrame.
Plugins for eFrame
eFrame is designed using a plugin mechanism for three key functionalities in the application. This architecture allows for ease of extension, so functionalities that are not supported by the application can be developed independently.
Calculations plugins
This plugin category enables development to support alternative calculation engines. The standard available plugins of this type are AFM, Excel and Matlab calculations.
This plugin takes care of the interaction with the calculation engine, the population of the model used and the extraction of the resulting data. The population and extraction of the data is based on the taxonomy of the input data and of the model itself.
Workflow plugins
Plugins of this type allow customized workflow steps to be added to the standard eFrame workflow. Once the plugin is installed, the user has it available in the configuration of the workflow and can map steps in the process to trigger its execution.
An example of such plugin is to trigger an external supporting tool after a signoff has occurred, or to create a specific output file in the middle of the process.
Data plugins
Plugins of this type allow for the creation of data file in a proprietary format. If a system needs data files in a very specific format, the plugin can be implemented to obtain the data from the eFrame database, and write the actual file.
Reporting
Product roadmaps are in a position to supply a company with vital disparity that links extensively to success and letdowns at the time of selling and distributing commodities as well as services to the marketing place. Within an association, the senior manager is answerable to the management of a product roadmap. Roadmaps have extreme number of benefits which include:
- maintenance of crucial customers;
- making sure that all the business and channel partners are intact;
- allowing a room for the product roadmaps to guide the strategic planning and realization of goals of a company.
In case a corporation is interested in having changes in production of roadmap documents, it is merely feasible via creation of roadmaps repeatedly, its constant updating and presenting to the audiences internally and externally. The situation would be better if an organization needed a roadmap document approved by sales department and the company management that demanded a product overview.
A product administration expert who is commissioned with the accountability for the final achievement of a product line is of principal significance because he or she creates a roadmap document that can drive strategy and present a comprehensible proposal on the targeted production efforts. This roadmap can be shared easily by means of organization’s shareholders, business partners, market analysts and the journalists. A product roadmap document may be suitable if supported by the presales of the entire company.
Manifestation, appearance, press releases, shareholders and business conferences have excellent examples of product roadmaps to guarantee consumers, associates and the human resource that there is a reliable and well-argued plan of action that guides its business. Diverse assortment of dissimilar descriptions for all the approaches of preparing roadmap documents ought to be present. The essential opinion to stick on is to find and get used to the type of a roadmap document that one is contented with and which is the best.
When preparing a product roadmap document, there are a diverse number of stages that ought to be put into consideration which include:
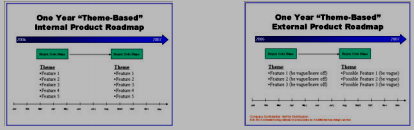
- Make verdict on the kind of a roadmap document one will use based on the requirements for a roadmap document needed.
- Put into consideration the duration of the process taking into account how long it takes and how hard it is to produce the goods of a certain type.
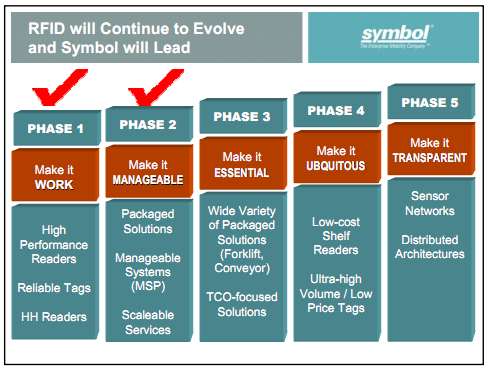
- Inspiration on the important drifts that one may wish to stand for on your roadmap document is also important. This comprises of technology used, selling forces as well as the moves the competition has made recently.
- Note precisely necessities from the key domestic shareholders in the scheme of the roadmap document and prioritize them carefully to establish and maintain traceability.
- It is necessary to define a deadline for the product to be done. Thus, one should always consider the time, when creating a plan of the process of production, and include the calculated time in the roadmap document.
- Plan carefully the presentation of the product because it will create a certain image of the given good and predetermine its success at the market. It is necessary to see the approved strategy to be correctly realized as it was planned because it is the main goal of schedule to think over every step beforehand.
There are potentially numerous facial appearances one could wish to draw your attention to concerning the manufactured goods or product roadmap document. Nevertheless, for the use of shortness and simplicity, it is necessary to state clear what is more important to achieve in the future production and delivering services and reflect it in the roadmap respectively. When one wants to represent a variety of product lines, he or she is expected to come up with a certain plan concerning his/her goods or services and then use the selected product as a draft or a model for the others to follow as it is reflected in the roadmap document.
It is indispensable to comprehend from the start of business. While taking the task with industrial viewers in convinced operational environments, there may be a blond bit of confrontation or resistance coming from the internal departments or product groups of the company that one needs to conquer. At the end, a lot of inner stakeholders may take resentment in the discharge cycle because the firm features are scheduled in the roadmap document. It may be declared sturdily or even insolently that the management is counterfeit. It is crucial to be at a position of giving interpretations on why the roadmaps are obligatory and the real reason why managing without roadmap at definite stage of business becomes unsustainable.
Numerous numbers of points can be used in preparing the product roadmap document. They include the following guidelines:
- Ensure that you team up early with your group. The need to protect an eventual buy-in from the diverse internal constituency groups within your company rises demandingly when it is incorporated with the roadmap document project’s outset.
- Always use system names on your roadmap documents because when accepted by the supervision group, it is easier to get a discharge to the community in a whole. If one is not convinced of his or her roadmap documents, then there are no outlets for the information to anybody including the senior managers. Amendments of the code names to the last stage of the scheme names are done when they are approved.
- Product roadmaps may sometimes lack sense of global assortment, thus calling for countless follow up of the forum.
Overview
Basing my overall point of view on the product roadmap template and chapter, the reporting shows that for any organization or a business sector to attain the set goals, it ought to have a clear and well strategized product roadmap. This is needed to ensure that everything planned for is followed keenly for the accomplishment of the set objectives and goals of the firm within the duration stated.
In conclusion, product roadmaps should be constantly sustained and rationalized. The program aphorism should not be given in. The actions of formation as well as discussions that surround the roadmap process are initiated by the managers. These actions are definitely fundamental gears of successful long expressions of the goods and services organization and managing approach. Mostly, roadmaps are applicable when sharing knowledge and skills with in-house lineup, external constituents as while as organizing factor for the manufactured goods by the administration group. Either of the chosen methods or criteria that one opts to use should shape out whether the attainment of the targeted goals is reached within the period focused in a roadmap of the organization.