
Introduction
Renewable Energy
Greenhouse gas emissions have increased significantly in recent decades. This has led to global warming and rising surface temperatures. Governments have been at the forefront of efforts to limit global warming to 1.5 degrees Celsius [1]. Many “scientific studies suggest that exceeding it could have serious and irreversible consequences for both ecosystems and human societies [1, p. 14822].” Countries have had to embrace low-carbon renewable energy technologies in various sectors. Therefore, expanding these initiatives can help the US achieve net-zero emissions in the future.
Definition
Clean energy is a sustainable alternative for. Many countries have adopted these techniques over the last two decades to respond to growing awareness of the effects of climate change. The clean encompasses a diverse array of sources that harness natural processes to generate power [2]. They offer a sustainable and environmentally benign alternative. Wind and sun always blow and shine, even if their availability depends on the weather.
Solar Photovoltaic Energy
Solar Photovoltaic Production in the US
The US has recently recorded significant growth in solar photovoltaic (PV). Its production in 2020 “grew by 22%, exceeding 1000 TWh and setting a record growth rate of 179 TWh [3, p. 7919].” This trend has made solar energy the second-largest green energy technology after hydropower.
Federal and state government policies support the use of solar energy as a renewable energy source. They have influenced the adoption of these sources through legislation like tax credits, financial incentives for firms, and clean energy mandates [4]. A perfect case of these efforts is the passage of the Energy Policy Act on 8 August 2005 [5]. It offers loan guarantees and tax incentives for the production of various energy sources.
The mid-2000s were a period when the US witnessed significant expansion and cost reduction of solar PVs. The country’s tremendous efforts have made it the second-largest producer of solar energy globally. This was mainly due to significant technological advancements and economies of scale in various industries [6].
People in the US started paying less due to advances in solar cell manufacturing, production processes, and module efficiency. These declining prices and economies of scale in manufacturing and installation made solar PV increasingly cost-competitive with conventional energy sources [5]. The US also saw increased traction in grid-connected solar PV installation. This was a result of the net metering policies and utility-scale projects. Many people have currently installed the systems in their homes and businesses. They are now more informed about their economy and environment.
The solar PV market in the US has matured and diversified since the early 2000s. There was continued growth in installation across residential and commercial sectors. The country also surpassed significant milestones in solar PV deployment during this period [7]. These efforts have made large-scale solar farms and utility-scale projects more common in recent years. Power purchase agreements (PPAs) and competitive procurement processes supported this prevalence. This expansion has gone beyond traditional solar-rich states like California and Arizona.
Solar PV production in the US has continued to grow in recent decades. This has been associated with fluctuations caused by policy changes and market dynamics. This trend continues to rise despite various challenges, including the COVID-19 pandemic and policy uncertainties [7]. These trends have reduced costs, influenced technological advancements, and increased climate awareness. This has yielded a record-breaking 32.4 gigawatts of new electricity-generating capacity.
One study found that “rooftop PV system installation in the United States has witnessed a 71-fold increase in the last decade [4, p. 440].” This implies that the outlook of this production in the US remains promising. It “surpassed 126 GW of installed capacity in 2020 alone, whereas the cumulative solar capacity stood at 720 GW in the same year [6, p. 3].” This was a 94.3% increase over what was recorded worldwide a decade earlier [3]. It implies that many organizations and individuals have shifted their attention to this renewable energy source.
Solar Photovoltaic Energy Supply
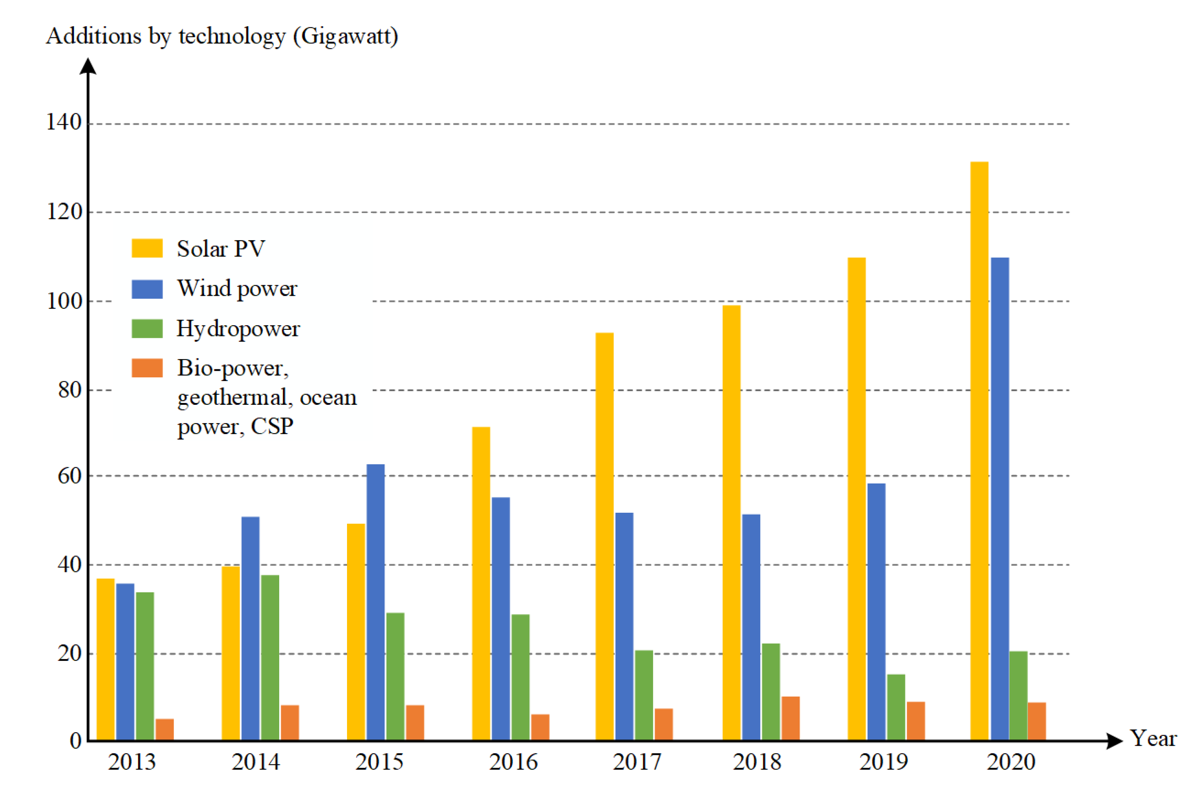
Solar energy still accounts for a small share of the US energy mix despite the explosion in installations. It only accounts for “2% of the global electricity generation and 3% of the U.S [6, p. 3].” Despite this small contribution, the country should recognize that it is a relatively new technology compared to wind turbines and hydroelectric power at scale. Based on rapid economic feasibility and technological development in the last decade alone, solar generation is predicted to rise. It may climb “from 11% of the U.S. RE capacity in 2017 to almost 48% by 2050, and 45% of the total global electricity mix, making it the fastest growing source of electricity in the world [6, p. 4].” As shown in Fig. 1 below, this energy source has had the highest annual installations from 2016 to 2020 [6]. The gap between solar and other clean energy sources has been widening in the US every year.
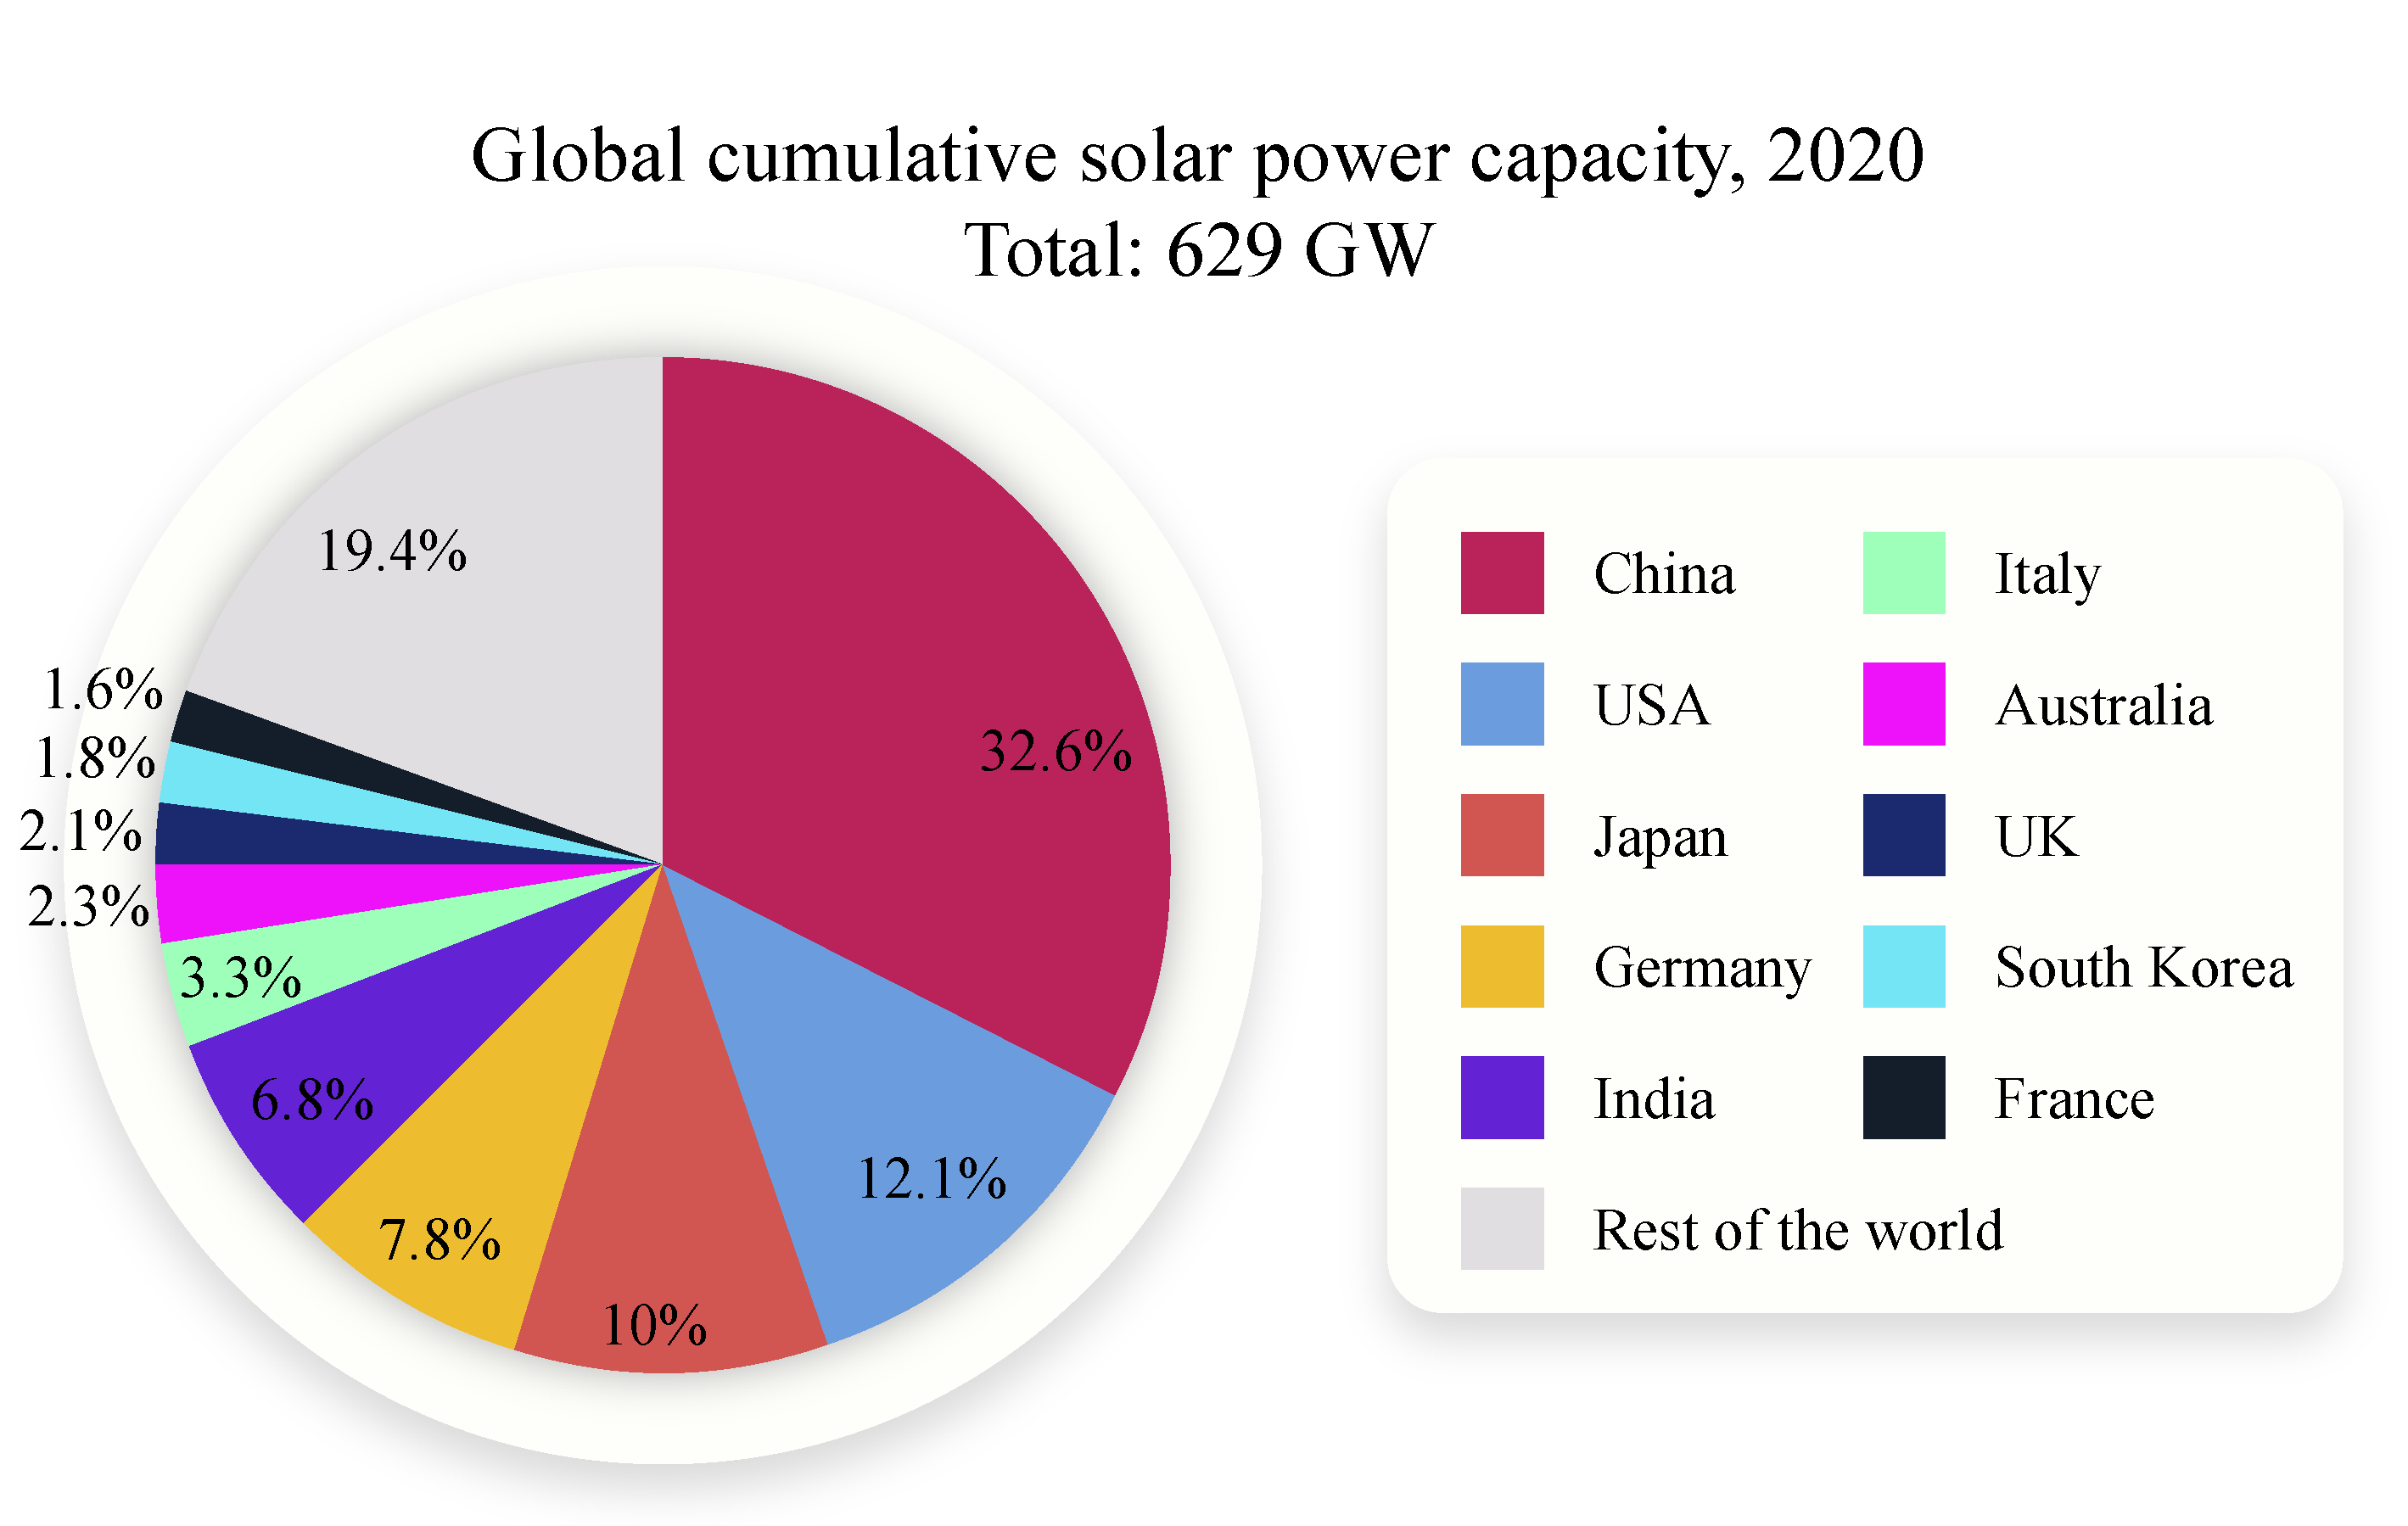
Many other countries have also joined the US in its race to decarbonize its electricity sector. As shown in Fig. 2, China leads the solar power race with 32.6% of global generation, followed by the US (12.1%), Japan (10%), Germany (7.8%), and India (6.8%) [6, p. 4]. The US is still the second country in terms of the ratio of total solar generation to the time required for production. Even though nations might have more installed capacity, they can, at times, have fewer solar resources that yield low power. None of the big solar producers contributes much to the overall solar penetration mix. Nations like Yemen, Luxembourg, and Mauritania have more than 12% and 20% of their national power generated from solar energy [6, p. 4].
Even though the “U.S. is one of the most prominent nations in solar generation, it has not tapped into its full potential of solar energy, which only contributes 2.3% to its energy mix at present [6, p. 4].” The US Energy Information Administration (EIA) reported in 2020 that the country had annual solar additions of 19.2 GW, surpassing the 14.2 GW of wind energy additions [6]. Therefore, the unprecedented progress of solar technology offers the US an opportunity to become the frontrunner.
Solar technologies in the US have been applied in residential, commercial, and utility settings. Reports show that “rooftop PV has a growing market in the U.S., with 3.2 ???? annual addition in 2020, while commercial installments were 2.7 ???? [6, p. 8144].” Fig. 3 below shows the graphical overview of annual solar additions in the US. It shows that the country records more residential PV penetration than others.
In 2020, utility PV installations in this nation exceeded 14 ???? and are the largest sector by both annual installed capacity and cumulative capacity. Currently, it “has more than 2500 utility-scale solar PV electricity generation facilities [6, p. 5].” Commercial solar projects have helped install panels for homeowners and businesses across the US.
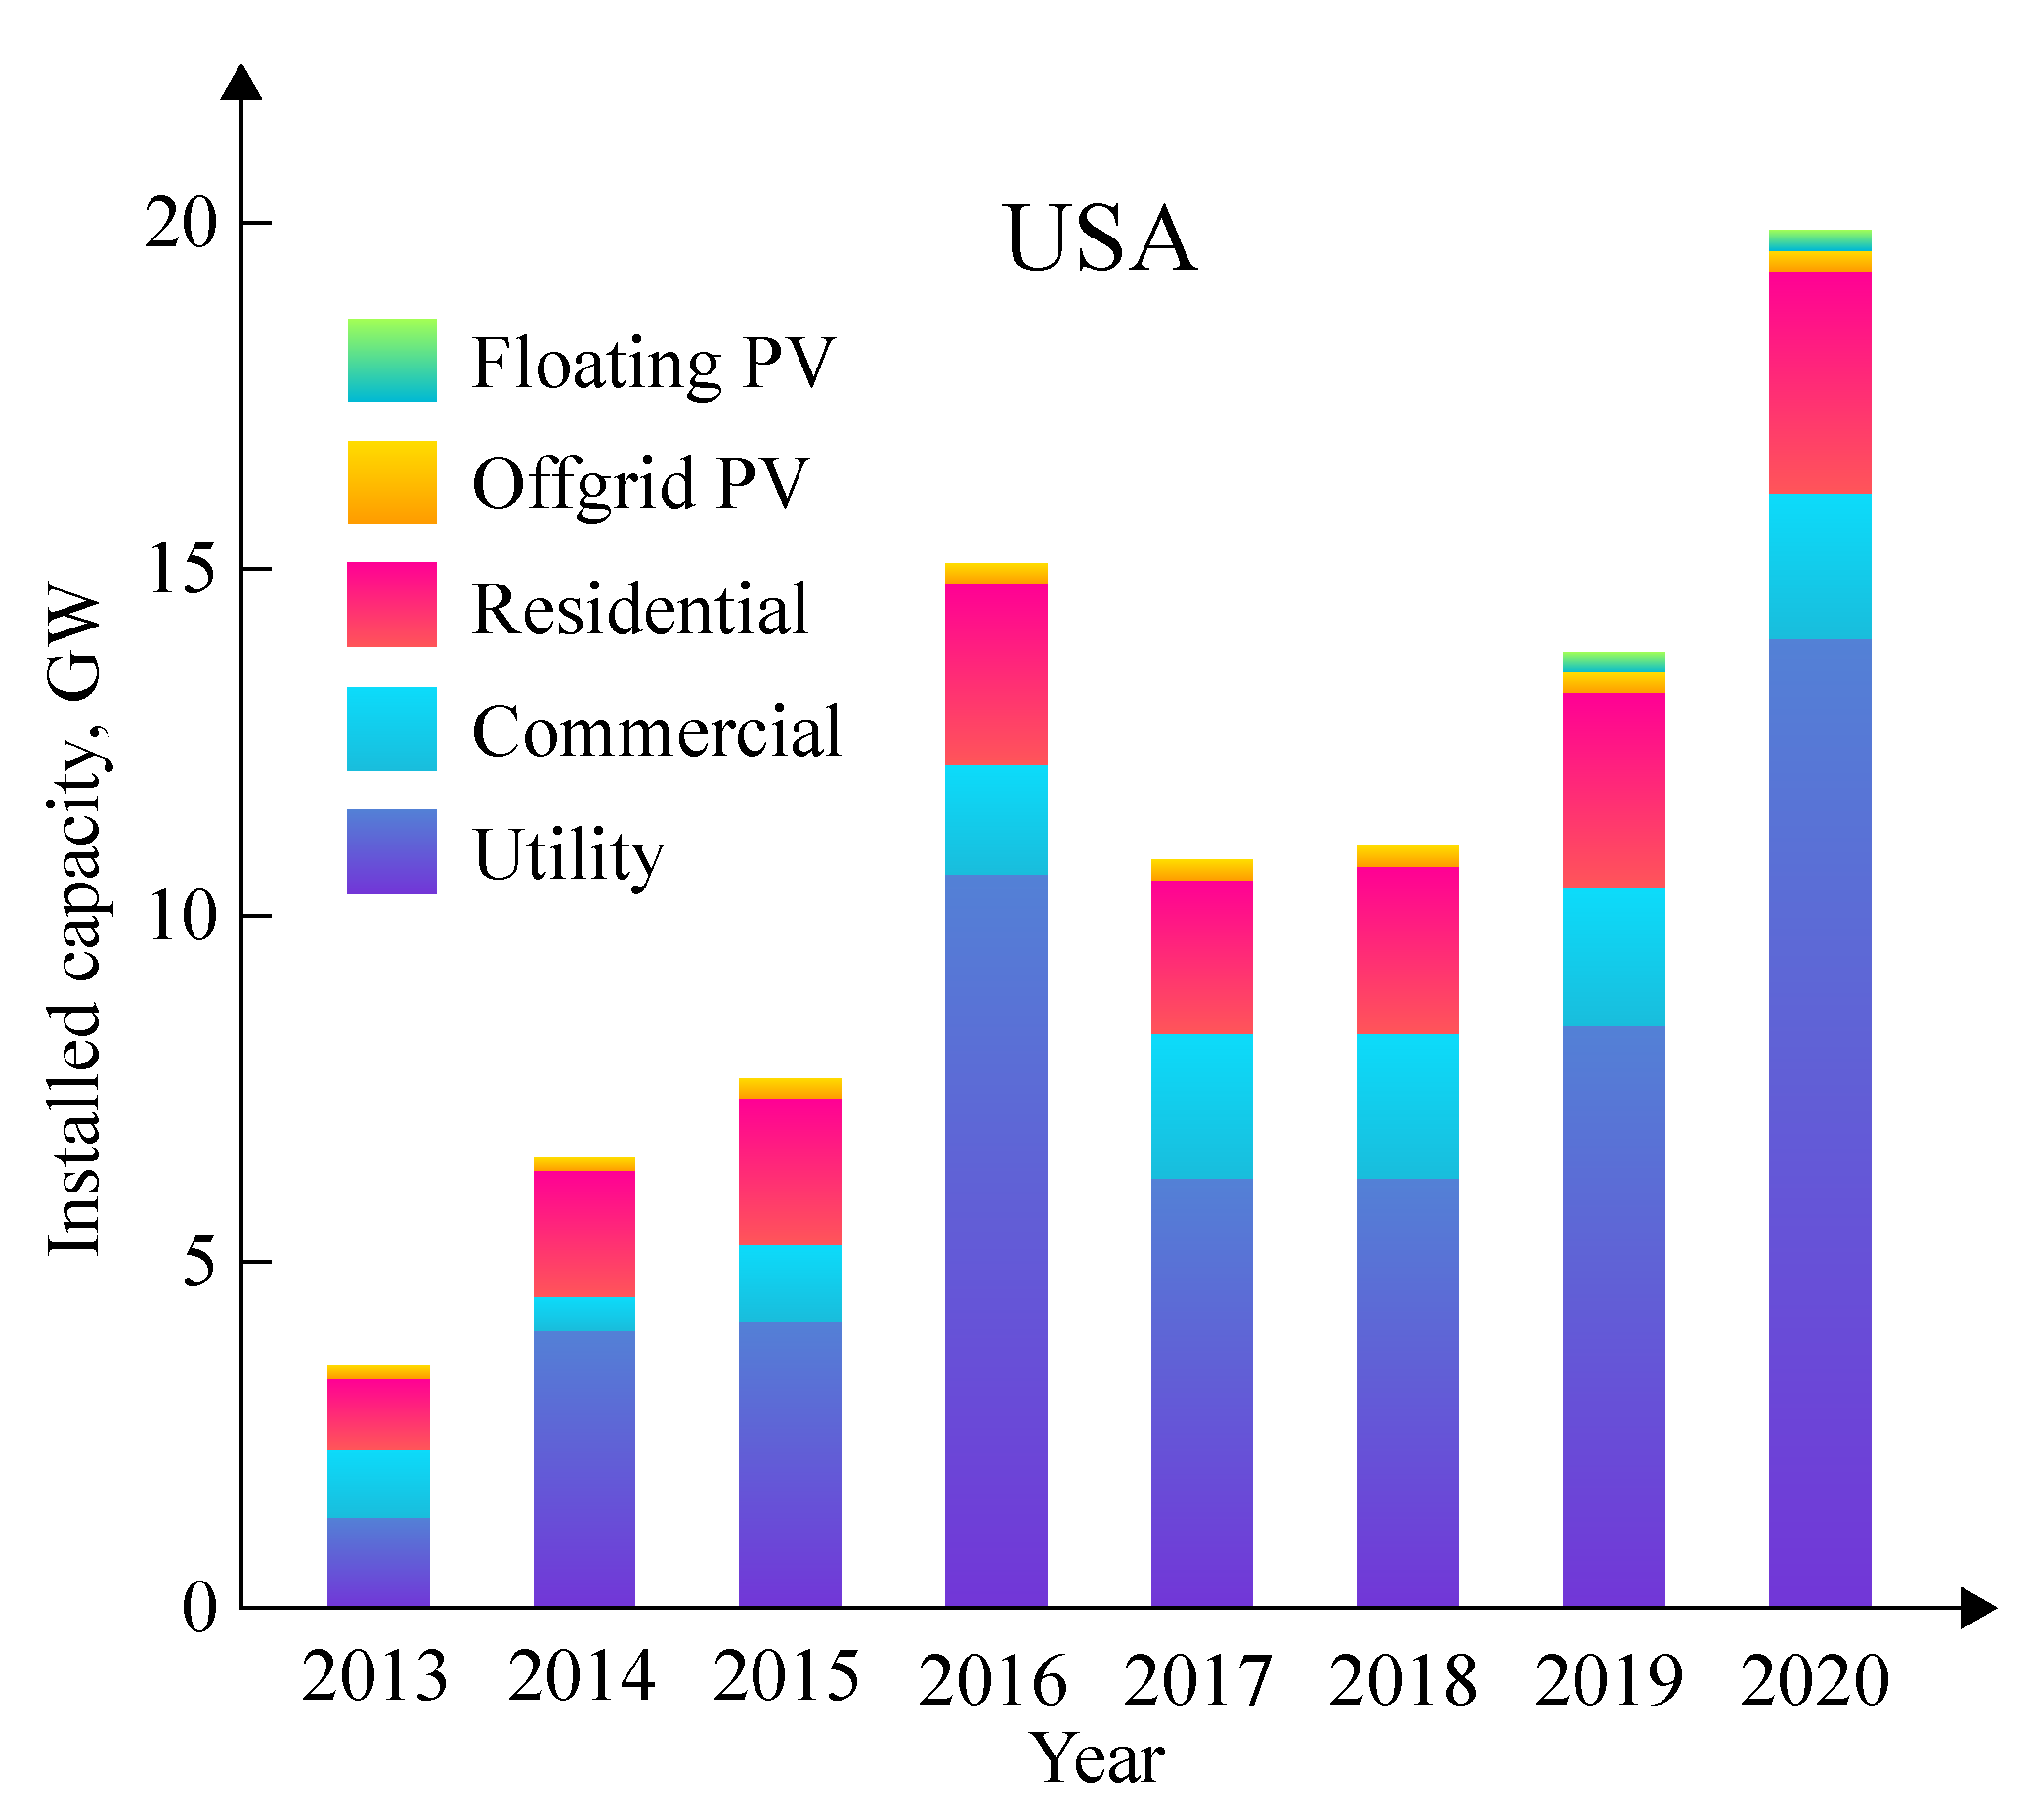
The US also reports higher rates of floating solar PV (FPV) use. It refers to the installation of solar panels on stagnant and man-made water bodies. In addition to generating electricity, this third application addresses conflicts regarding excessive land usage and site preparation costs [6]. The US is considered the first nation to introduce commercial floating solar PV in California [6].
Moreover, “if solar were installed on just a quarter of the man-made water bodies in the U.S., it would account for 10% of the country’s electricity needs [6, p. 5].” The largest FPV installation in the US as of 2021 is the 4.78 MW Healdsburg project in California. The country has the potential for future FPV growth, especially since it has tapped less of it.
Simple Payback Period
The initial investment in solar energy includes the costs of solar panels, mounting hardware, and any other additional equipment required. The upfront costs often depend on the size and complexity of the system. One news report from Forbes highlights that “the cost of solar panels ranges anywhere from $8,500 to $30,500 or $2.40 to $3.60 per watt including installation, with the average 6kW solar system falling around $12,700 [8, para. 1].” The most popular choice in the US is monocrystalline solar panels because of their efficiency and cost-effectiveness.
People in the US who install solar PV for commercial purposes have ended up investing more than those who install it for residential purposes. These individuals have higher system capacities and additional infrastructure requirements that need more equipment. A recent report indicates that the average installation cost of a solar system depends on size [8]. Their prices often range from $10,200 to $15,200 across the US [8]. This applies to businesses that must undergo extensive planning and engineering processes to effectively install the systems. However, solar energy has long-term potential.
Solar energy systems have proven to be more efficient than traditional ones. They have relatively lower operating and maintenance costs. Despite this, these frameworks still require maintenance to ensure maximum performance. They may have to spend on cleaning the solar panels and performing minor repairs [7]. One report notes that residential solar PV systems in the US require about $200 per year after purchase [8]. The higher system capacity of commercial-scale equipment may sometimes lead to slightly higher maintenance costs. This does not affect the fact that the systems provide substantial savings.
Solar energy has also been associated with the potential to save energy over the long term. These systems generate electricity from the sun and offset the need to purchase other unsustainable forms. This often depends on system size, local electricity availability, and energy consumption patterns.
Homeowners in the US can typically pay around $1,000 annually on electricity bills with a residential solar system [9]. These savings are even greater for commercial-scale installations [8]. Business owners can be more attracted to invest in them because of their overall financial attractiveness. The sources can also help homeowners and businesses in the US recoup the resources that were shifted to them during purchase.
Governments at the federal and state levels provide various financial incentives to developers. This has enabled them to promote the adoption of solar energy and offset the initial investment costs. They may include tax credits and performance-based incentives for those in this sector.
For instance, the federal government offers a 30% tax credit of the total buying price [10]. It applies to all solar projects that began operating in 2024 and are expected to last through 2033 [10]. Washington also provides a sales tax exemption for equipment and machinery used in solar energy systems. Similar rules are also available in other US states. Homeowners can take advantage of this to improve the financial viability of investing in solar energy.
Pros and Cons
The US has recognized solar energy as a renewable and sustainable energy source. Developers often generate this electricity from sunlight using monocrystalline solar panels. They are finite and contribute to environmental degradation in the US. These sources harness natural power without depleting finite resources [3]. This makes it an inexhaustible and environmentally friendly option for generating electricity.
Additionally, these systems do not emit greenhouse gases or other harmful pollutants [5]. They also provide businesses and communities with greater energy, independence, and resilience. It reduces the dependence on centralized power grids and volatile energy markets.
On the other hand, solar energy generation is intermittent and dependent on weather conditions. Variability in rainfall or cloud cover relative to daylight hours can affect the reliability and consistency of solar power [3]. Regions with unpredictable weather patterns or seasonal fluctuations in sunlight. These systems also require a significant upfront investment for installation and equipment purchase. This can be a barrier to entry for some homeowners and communities. Moreover, solar energy requires energy storage solutions, such as batteries, to store excess energy. Despite their advancements, current options can be expensive and have limited storage capacity.
Wind Energy
Production and Supply in the US
Wind energy has experienced significant growth in the past decades. The scalability of wind energy has been remarkable, especially in regions with favorable wind conditions. A recent news report by Reuters indicated that “US electricity generation from wind power is on course to surpass coal-fired electricity generation, potentially by 2026 [11, par. 1].”
The country’s total annual electricity from wind power was about 434 billion kWh in 2022. It was a tremendous increase from about 6 billion kWh in 2000 [12]. In many states, people are reducing coal use and shifting to wind power. Wind output is steadily becoming a major part of the country’s electricity generation mix.
Power generation firms in the US have begun embracing renewable energy and reducing reliance on coal-fired power stations. In 2015, “before US power producers accelerated renewable power development – coal-fired electricity generation was nearly 700% greater than electricity output from US wind farms [11, par. 5].” However, utilities in the country have cut coal by 30% since 2015 and shifted to wind by over 90% [11]. Even though wind generation traditionally picks up late in the year, studies still predict that many people in the US will consider it an alternative [12]. It does not affect the atmosphere or the world’s ecosystems.
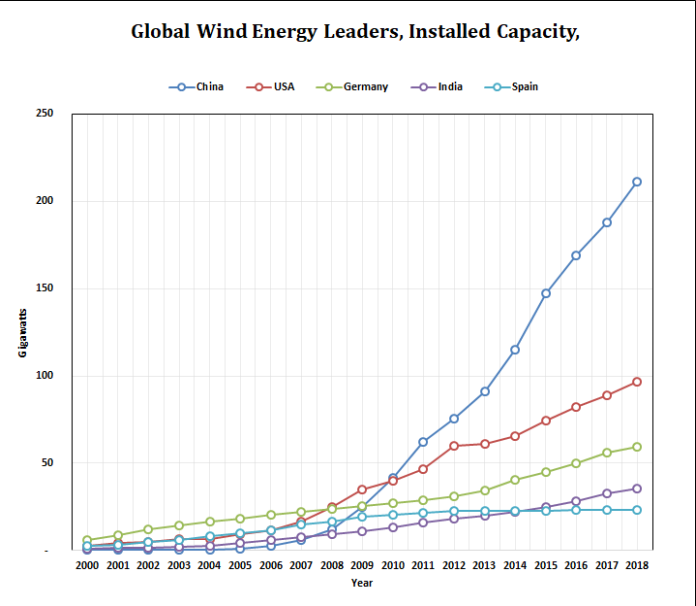
The US also compares significantly with other countries in terms of wind power adoption. It is considered the second nation in the globe with about 96 GW [12]. As shown in Fig. 4, China has an installed capacity of 217 GW and is currently the leading country in total installed capacity [12]. It also shows that Germany is third with 59 GW, India with 35 GW, and the UK with 21 GW [12].
The largest wind-generating state in the US is Texas, which can power 12.2 million homes. This source could power about 46.72 million homes across the country [11]. However, intermittent wind-fed electricity implies that people still have to keep fossil-fuel-powered plants.
Wind energy also contributes a better portion to the US energy mix. The country can now reduce its dependence on fossil fuels for electricity generation. Wind farms in the country are harnessing clean, renewable energy resources, thereby contributing to sustainable and resilient energy infrastructure [8]. The intermittent nature of this energy source presents significant challenges for grid integration [11]. However, advancements in grid technology and demand response innovations have helped address these issues and maximize the benefits of the grid.
Many policies have been implemented nationwide to encourage people to embrace wind power. Congress signed the Inflation Reduction Act (IRA) into law on 16 August 2022 [12]. This act increases production and investment tax credits for wind energy projects through 2024 [12]. This will be replaced with technology-neutral credits for the generation of low-carbon electricity in 2025 [12]. The production tax credit (PTC) allows people in the US with wind energy facilities to claim the incentive.
Simple Payback Period
In the US, wind energy projects often require a significant upfront investment. Individuals and organizations need money to buy wind turbines. The prices of this equipment often depend on its size and model. One may also be required to cover the transportation costs to project sites and crane rental expenses for turbine installation [10].
Moreover, they have to reallocate some funds to cover site preparation and foundation construction. This may also vary depending on terrain complexity and labor availability [12]. Those operating in remote areas may have to incur additional costs due to logistical challenges.
The second simple payback period for this source is its high energy production rates. Wind turbines generate electricity by harnessing the kinetic energy of wind [11]. This varies depending on factors like the speed and direction of the wind. Wind power generated about 434 billion kWh in the US in 2022 [12]. This energy can be used for lighting and heating, among many other activities.
Additionally, project developers in wind energy have various financing options available. These may include debt financing, project finance, and third-party financing arrangements [13]. These individuals also receive government incentives and subsidies. The authorities aim to use these initiatives to make wind power attractive. The US federal and local governments have also offered production tax credits and feed-in tariffs.
Pros and Cons
Many countries have made significant efforts to encourage people to embrace wind energy. This new source of energy does not emit greenhouse gases like fossil fuels. It does not contribute to air pollution and climate change in any way [12]. It is a sustainable, environmentally friendly alternative because it relies on wind energy.
Americans can harness this source to reduce their carbon footprint. It can also help them mitigate the harmful effects of climate change. The system also contributes to cleaner air and water. It reduces the country’s reliance on fossil-fuel-based power plants that emit harmful emissions [12]. This continued transition of Americans to wind energy can improve air quality and reduce the risk of respiratory illnesses [14]. This aligns with the global efforts to combat climate change and promote sustainable development.
Wind energy is also preferred by many people in the US because it is more available and accessible. It uses turbines to generate power and can be installed in various types of locations. This versatility enables the development of wind energy projects across diverse geographic regions [11].
It is unlike solar and hydroelectric power because it can be leveraged virtually from anywhere. Moreover, advancements in wind turbine technology have facilitated the deployment of more efficient systems. This has further expanded the potential of wind energy development [14]. Improvements in manufacturing processes and materials have significantly reduced the cost of this power. This has made it increasingly competitive with conventional forms of electricity generation [8].
Many people in the US now see it as a viable and scalable solution to their electricity needs. Some of them have also embraced it because it creates jobs and stimulates economic growth. Landowners and governments also stand a chance to receive tax revenues and lease payments from these activities. These can support economic development and revitalization in rural areas.
Wind energy has also been associated with lower operating costs than conventional electricity generation. The operational and maintenance costs are relatively minimal once the turbine has been installed [11]. The firms will only need to pay for routine inspections and occasional repairs. This is unlike fossil-fuel power plants, which require ongoing procurement and combustion [8].
The turbines harness the natural power of the wind and eliminate fuel costs and associated emissions. This energy source also has a long lifespan and requires little human intervention after installation. Advances in predictive maintenance technologies and remote monitoring systems have been integrated to enable proactive maintenance scheduling and early fault detection.
Wind energy faces higher levels of intermittency and variability. This stems from the unpredictable nature of wind patterns and weather conditions. Turbines used in these projects are unlike conventional power plants. They depend on the wind’s speed and direction to meet their power demand. However, these natural factors always fluctuate and can affect production [12]. This makes wind energy production vary widely over time, posing challenges for grid stability and energy supply management.
Grid operators may also be compelled to balance supply and demand in real-time to maintain reliability. This variation may require backup power sources, such as natural gas or hydroelectric plants [13]. Energy storage solutions, such as batteries, may be needed to store excess energy during periods of high production for use during lulls in wind availability.
Wind energy also has visual and environmental impacts. Large-scale wind farms have rows of towering wind turbines, which come with their own problems. This can alter scenic views, disrupt wildlife habitats, and generate noise that affects nearby residents. These can lead to opposition and resistance from stakeholders, complicating the siting and permitting process for projects [11]. Moreover, grid integration issues like congestion and voltage fluctuations may arise as wind energy penetration increases.
Hydroelectricity
Production in the US
The US has made significant efforts for centuries to perfect hydropower production. Engineers and entrepreneurs in the mid-19th century became the first to recognize this potential. They produced and used this to drive machinery and light homes.
The most iconic hydroelectric project in the US is the Hoover Dam. This historical infrastructure was completed in 1936 on the Colorado River [15]. Its construction provided millions of people in the country with electricity for many years.
It also facilitated irrigation and economic development in the arid southwestern region. Federal initiatives such as the Tennessee Valley Authority and the Rural Electrification Administration were among the efforts the government made [16]. They electrified rural areas by powering industries and supporting economic growth.
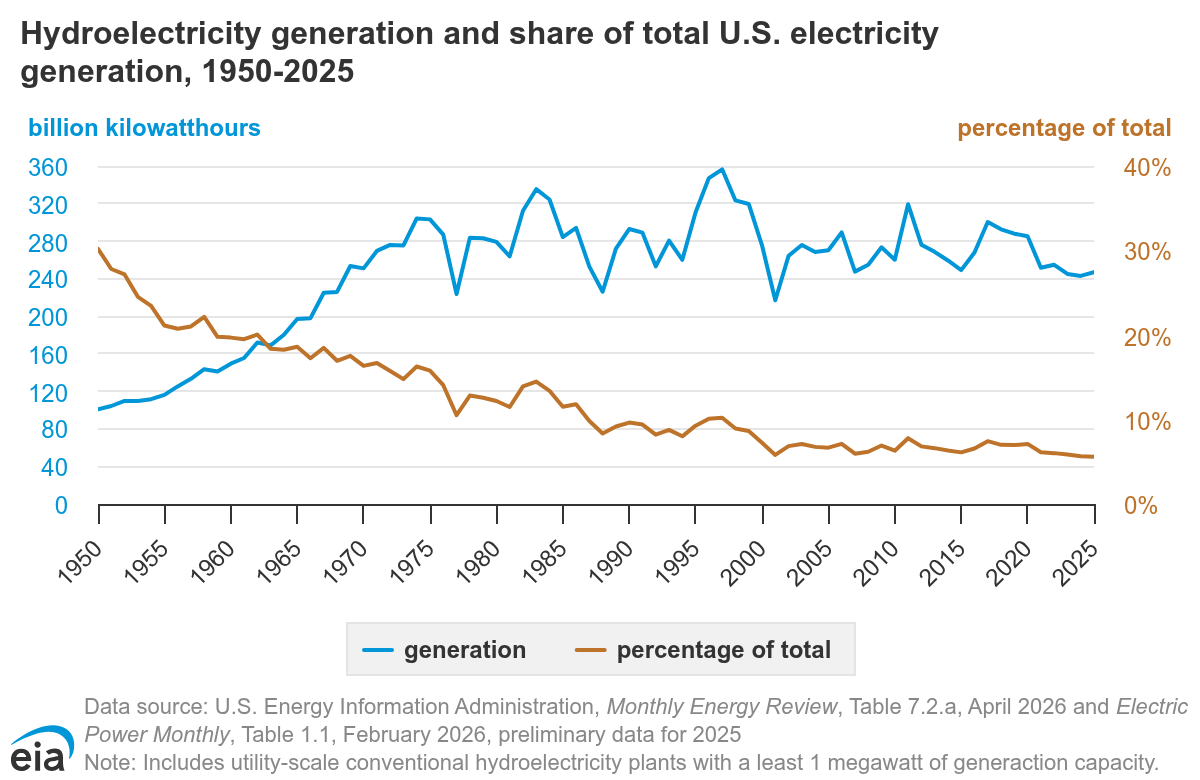
America uses various types of energy sources to generate electricity. A recent report indicates that hydroelectricity has consistently accounted for a higher share of the energy mix [16]. The 2022 study indicates that it “accounted for about 6.2% and 28.7% of total utility-scale electricity and renewable electricity generations, respectively [16, para. 1].”
Fig. 5 shows that its production has varied from year to year. For instance, the share of this source in the country’s total electricity generation decreased significantly from the early 1950s to 2020 [16]. This trend is specifically due to increased public awareness of climate change and the adoption of alternative sources.
Its percentage “share of total annual US electricity generation in 2001 through 2022 averaged about 6.7% [16, para. 4].” Moreover, the nation recorded about 23,050 MW of total pumped-storage hydroelectric generating capacity in 18 states in 2022 [16]. California is the leading state in generating this form of energy, followed by Virginia and South Carolina.
The US compares significantly with other countries worldwide in hydroelectric power production. According to one article from NS Energy, the global “hydropower capacity increased from 960.5 gigawatts (GW) in 2008 to 1,270.4GW in 2017 [17, para. 3].” The US is the second-leading nation in the generation of electricity from the gravitational force of flowing water. It recorded an installed capacity of 102 GW in 2017 [17]. It has the world’s biggest hydroelectric power plant, “the 6.81GW Grand Coulee hydropower project located on the Columbia River in Washington [17].”
The US is immediately after China, which had more than 341.1 GW in 2017 [17, para. 6]. It is home to the 13.9 GW Xiluodo Gam, which features 18 Francis turbine generators of 770 MW [17]. The US is above other top hydropower producers, including Brazil and Canada.
Simple Payback Period
The upfront investment required for hydroelectric projects varies significantly all over the US. For instance, large-scale hydroelectric dams and reservoirs involve significant capital expenditure for civil engineering works. Firms will have to pay for water intake structures and powerhouse facilities [17]. The costs associated with turbine procurement and grid interconnection also add to the project’s overall investment.
The construction of major hydroelectric projects in the US, such as Hoover Dam, required billions of dollars in capital investment. The country spent $48.9 million on the Hoover Dam, $24,000 more than the Department of the Interior had budgeted [15]. While smaller-scale hydropower facilities may have lower upfront costs, they still require investment in equipment and infrastructure.
Operational efficiency and capacity factor affect hydropower revenue generation in the US. It is always important to consider the ratio of actual electricity generation to the maximum potential production. This consideration is vital because water availability and seasonal fluctuations also influence the way these facilities operate.
Dams with large reservoirs and regulated flow regimes have relatively higher capacity factors. They are more consistent in electricity generation across the country year-round. However, run-of-the-river hydroelectric plants may experience lower output due to variations in river flow [17]. This can lower the profitability of the power generated and its future. Firms can leverage advanced turbine technology and optimal reservoir management to address these possible issues.
The price of electricity in the wholesale market and the regional demand-supply dynamic also play a part. Hydroelectric plants with long-term power purchase agreements may benefit from stable revenue streams. This can also affect those with contracts for fixed feed-in tariffs.
However, fluctuations in market conditions and regulatory policies can introduce uncertainty into revenue forecasts. This effect can potentially prolong the payback period that the country expects [17]. Periods of low electricity prices in the market may also reduce the time required to recoup the initial investment.
Pros and Cons
Americans have identified hydroelectric power as a clean energy source. It uses the gravitational energy of flowing water to generate electricity without emissions. It produces minimum carbon emissions and pollutants during operations.
This makes it an environmentally friendly alternative that aligns with global efforts to combat the effects of climate change. It also influences a significant transition to a low-carbon energy system [17]. The world has a continuous flow of water in rivers and reservoirs, which can help keep the grid stable and secure.
This source of power also offers unparalleled reliability and predictability in electricity generation. Other renewable sources, such as solar and wind, depend on weather conditions and time of day. However, hydroelectric facilities provide consistent baseload power or peak capacity to meet growing demand [15]. Reservoir-based projects can regulate water flow and store energy when demand is low [17]. This ensures a continuous power supply to the whole country. It also reduces reliance on fossil-fuel-based generation during peak-demand periods.
Hydroelectric infrastructure also has a longer lifespan than other electricity-generating technologies. Dams and generators used in these projects are often built to last for decades. Moreover, firms can extend their operational life even further with proper maintenance and periodic refurbishments [16]. Hydroelectric power plants incur relatively low operating costs once constructed [17]. They are also free of fuel and eliminate the ongoing expense of fuel procurement.
Hydroelectric projects can significantly affect the environmental conditions of river ecosystems. A case like the construction of dams and reservoirs can alter natural river flow patterns and disrupt sediment transport [16]. It also fragments habitats that lead to the displacement of species and changes in water quality.
The creation of a reservoir overwhelms large areas of land and displaces communities. It also submerges forests and disrupts wildlife corridors all over the US [16]. Additionally, the regulation of water flow downstream can affect fish migration and alter sediment deposition patterns.
Hydroelectric projects entail significant cultural and social implications. They specifically affect areas inhabited by indigenous peoples and local communities [17]. The construction of reservoirs and dams may lead to the forced displacement of communities and loss of livelihoods.
Indigenous territories and sacred sites in the country may be altered. This might cause conflicts over land rights and the preservation of cultural heritage [16]. This source is also susceptible to geological hazards and seismic events. Moreover, sediment buildup in reservoirs reduces water storage capacity and impairs turbine efficiency.
Nuclear Energy
Production and Supply in the US
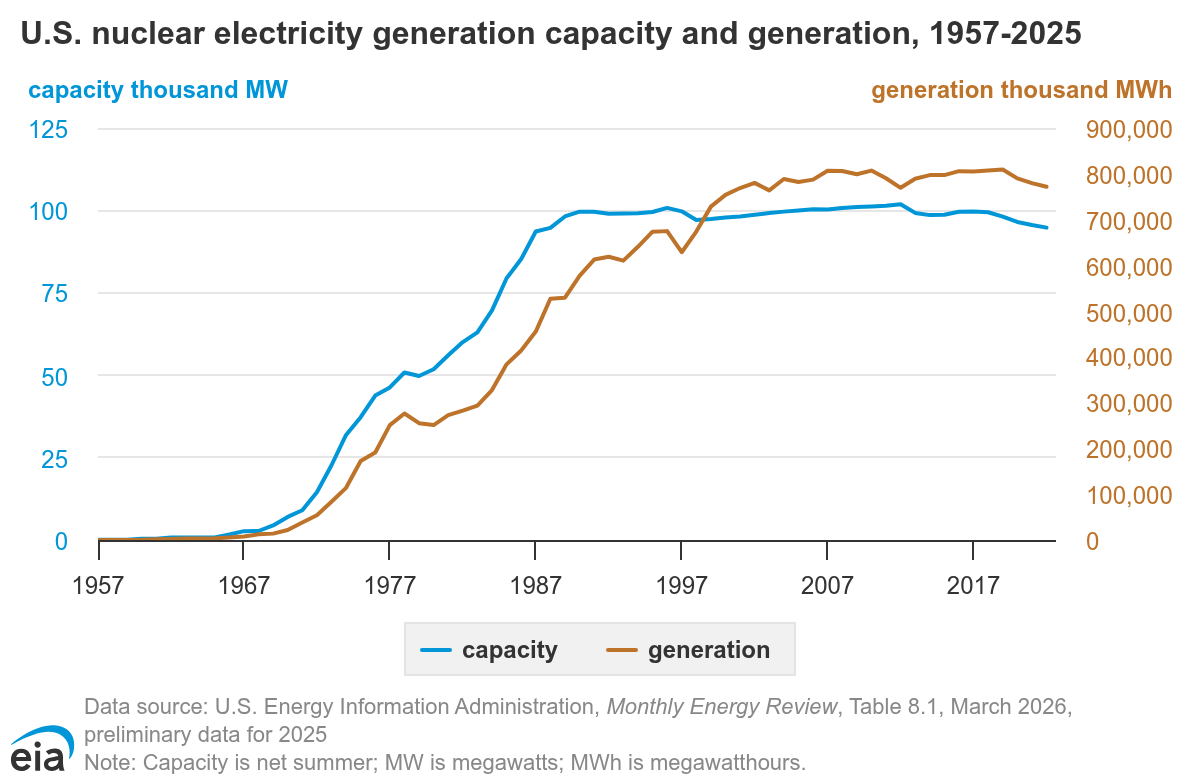
The US has a rich history of nuclear energy production and supply. This development dates back to the mid-20th century, around 1958 [18]. The current number of US nuclear reactors has reached a peak of around 112 [19]. Their net electricity generation capacity in the summer was 99,624 MW, as shown in Fig. 6 [19]. However, this number significantly declined to around 104 in 1998 and remained stagnant until 2013 [19]. Unfortunately, some of them have since been shut down, and there are now 92 operating reactors [19].
One report indicates that the “total US nuclear net summer electricity generation capacity peaked in 2012 at about 102,000 MW and declined to 94,765 MW in 2022 [19, para. 2].” Despite this trend, the remaining US nuclear reactor fleet still maintains high capacity utilization rates due to modifications to power plants. This has influenced its contribution of 19%-20% to the US electricity mix from 1990 to 2021 [19]. The government and other stakeholders in the nation have also shortened the period during which reactors are required to increase annual electric generation.
Nuclear power reactors are distributed all over the US to ensure access to renewable energy. Most commercial ones are located east of the Mississippi River [19]. Moreover, “Illinois has more reactors than any state (11 reactors at six plants), and at the end of 2022, it had the largest total nuclear net summer electricity generation capacity, at about 11,582 megawatts [19, para. 4].”
The Grand Gulf Nuclear Station in this state also has the largest nuclear reactor. It has a net electricity generation capacity of around 1,400 MW in 2020 [18]. However, those located in Prairie Island nuclear plant are considered the two smallest in the nation.
The US has made significant efforts to create new nuclear reactors. For instance, Unit 3 at Alvin W. Vogtle Electric Generating Plant in Georgia is the newest to enter service since 2016 [19]. It began commercial operations on 31 July 2023, with a net summer electricity generation capacity of 1,117 MW [19]. Its establishment was after the approval of the application of electric and gas firms to operate two new reactors by the Nuclear Regulatory Commission (NRC). Unit 4 in Georgia is nearing completion and is projected to begin operating by the end of 2024 [18]. All these efforts have made the US the largest producer of nuclear power, accounting for more than a quarter of the world’s total.
Simple Payback Period
Nuclear energy projects require substantial upfront investment due to their high initial capital costs. Debt financing can help offer the necessary resources to complete these activities. Developers can leverage funds from banks and other financial institutions.
Additionally, long-term debt instruments, such as project finance loans, can provide the capital needed to cover construction and operational expenses [20]. Those involved in these projects can also raise capital from institutional investors and private equity firms. However, their long-term constructions have made it challenging for them to access debt financing. The government may sometimes be forced to intervene by providing direct funding or loan guarantees.
In addition to the capital investment that nuclear energy projects require, developers must allocate funds for ongoing operating expenses. Fuel costs and decommissioning expenses can affect their simple payback period. For instance, lower operating expenses may reduce the time required to recover initial investments and generate positive cash flows [20]. Efficient operation and maintenance practices can contribute to these low costs and shorten the payback periods. Additionally, higher electricity prices and demand for this renewable energy accelerate generating profitability.
Pros and Cons
Nuclear power plants produce electricity through nuclear fission, which does not emit greenhouse gases during generation. As mentioned earlier, fossil fuel-fired centers often release large amounts of CO2 and other pollutants into the atmosphere. Nuclear reactors are unlike these sources as they generate electricity by splitting uranium atoms [20].
The lack of combustion during heat production makes this energy source a valuable tool for mitigating climate change and reducing air pollution. It provides a reliable stream of low-carbon electricity that can replace coal and natural gas [18]. Moreover, nations can leverage their low carbon footprints to meet their emissions-reduction targets. It is an opportunity for them to transition to cleaner, more sustainable energy systems.
This source of electricity also has an exceptionally high energy density compared to other conventional techniques like coal and natural gas. This implies that a small amount of nuclear fuel can generate a large amount of electricity over a longer period. This makes it a highly efficient alternative in terms of energy production and resource utilization [20]. It also enables nuclear reactors to operate continuously at high capacity factors and produce consistent, reliable electricity output [19]. Nuclear power can meet baseload electricity demand and effectively support critical infrastructure and residential consumption.
Nuclear energy is also associated with challenges in managing and disposing of radioactive waste generated during the nuclear fuel cycle. This includes radioactive byproducts and decommissioned reactor components. They often remain hazardous for thousands to millions of years because they have long-lived radioactive isotopes [20]. This requires a long-term storage solution that prevents environmental contamination and protects public health. Such facilities also face political and technical obstacles that delay waste management strategies.
The power plants of this energy source are potentially hazardous facilities that can pose significant public health and safety risks. In the event of an accident or malfunction, people and the environment are more likely to be endangered [18]. An accident like Fukushima Daiichi (2011) is a reminder of the potential consequences of catastrophic failures [20]. Such cases can release harmful materials into the environment. This can lead to radiation exposure and contamination of water and soil. The perception of this energy source as inherently risky can erode public trust and confidence in technology.
The construction of nuclear power plants also involves substantial upfront capital investments. The high initial finance encompasses various aspects, including reactor design, procurement, and licensing [19]. Nuclear energy production also requires extensive engineering and design effects and lengthy regulatory approval processes. This makes it more costly and time-consuming to develop than other forms [20]. These projects also face long lead times from initial planning to commercial operations. These delays can further lead to increased cost overruns and schedule slippages.
Evaluation
Total Production in the US
Renewable energy reduces greenhouse gas emissions and mitigates climate change. The US solar PV production exceeded 1000 TWh in 2020 [3]. This was a record growth rate of 179 TWh from the early 2000s [3]. Its cumulative solar capacity in 2020 stood at 720 GW. This represented a 94.3% increase from the previous decade [6]. The US predicts that solar will account for about 48% of its renewable energy capacity [6]. The declining costs of solar PV installations and increasing climate awareness have driven this growth.
The US generated electricity from wind power exceeding 434 billion kWh. This marked a substantial increase from just 6 billion kWh in 2020 [12]. Its scalability and favorable wind conditions in various regions have facilitated its rapid expansion.
The US ranks as the second-leading nation in total wind capacity. It recorded about 96 GW installed capacity in 2022, with Texas standing out as the largest wind-generating state [12]. Wind energy also diversifies the US energy and electricity mix.
Hydroelectric power has continued to contribute to the country’s energy mix. It accounted for about 6.2% of total US utility-scale electricity generation [16]. It also had 28.7% of total utility-scale renewable electricity production [16]. These projects provide millions of people with electricity in rural and urban areas. It remains a reliable and renewable energy source in the US economy.
The US energy sector has long relied on nuclear energy. It accounts for around 19%-20% of the nation’s energy mix [19]. The country now ranks as the largest producer of this form of electricity. It has a net production capacity that exceeds 99,000 MW [19]. For example, Illinois houses many nuclear reactors. This includes the Grand Gulf Nuclear Station in Mississippi. The US has also built new nuclear reactors in recent years.
Achieving Net Zero
The US should address various sectors of the economy in its strategies to attain net-zero emissions. The approaches should leverage a combination of strategies and technologies. For example, the government can consider deploying all these renewable energy sources.
This could be a better move, as the country has recorded significant growth in these sectors [12]. For instance, its solar PV installations have now exceeded 100 TWh. It also reported that wind energy output might surpass coal-fired power by 2026 [11]. Therefore, the US government can opt to further scale up renewable energy.
Efforts to improve energy efficiency across various sectors of the economy can also be important. An example would be people working in the building and construction industry. They can use energy-efficient appliances and smart thermostats. These can help them reduce energy consumption and emissions [16]. Moreover, transitioning to electric vehicles can help decarbonize the transportation sector [21]. These efforts can help mitigate the risk of increased emissions.
Technological advancements can also be leveraged to attain the net-zero emission goal. The US should continue research and development (R&D) in renewable energy and energy storage [21]. It can invest in advancements in energy storage technologies to overcome intermittency challenges.
They can also develop cost-effective carbon capture and storage techniques to mitigate emissions from various sectors. They should allocate resources to encourage innovation in sustainable agriculture and industrial processes [21]. Other recommendations include implementing appropriate policies and educating the public about the effects of climate change.
Benefits of the Project
Renewable energy and targeted net-zero emissions can help reduce greenhouse gas emissions. These systems involve replacing fossil fuel-based electricity generation with clean energy sources [17]. This can enable the US to reduce its carbon footprint and mitigate the effects of climate change.
Renewable technologies also have minimal air and water pollution compared to fossil fuels. Additionally, the shift also creates new economic opportunities for US citizens. It stimulates job opportunities and drives innovation that attracts investment [6]. Increasing resource allocation for solar and wind farms can also contribute to the development of rural areas.
Renewable energy technologies are also a step towards diversifying the country’s energy mix. This effort can reduce its dependence on imported fossil fuels and the effects of volatile global energy markets [21]. The sources of clean energy are always abundant and domestically available.
Switching to these electricity forms can also lead to long-term cost savings for consumers and businesses [8]. It can reduce their energy bills and avoid external costs associated with environmental pollution. These energy sources will also improve public health outcomes and enhance community resilience.
Challenges and Proposed Solutions
The investigation above revealed that each renewable energy source has some challenges. For instance, wind and solar face intermittency and grid integration challenges. These two are highly dependent on weather conditions that fluctuate over time [11].
The upfront costs were also reported as a significant hindrance to the widespread adoption of these innovations. The US government also has inconsistent policies and regulations that can hinder the deployment of these techniques. Therefore, the country needs to develop approaches to deal with these problems collectively.
The US government can provide financial incentives, such as tax credits and grants, to reduce the upfront capital costs of renewable energy projects. They can establish financing mechanisms such as green bonds and PPAs to facilitate private-sector investment [21]. They should streamline permitting and approval processes for these activities to reduce development timelines. There should be a significant increase in public and private funding for research and development programs [8]. Educational institutions should be included in the conversation about these issues and help find solutions.
Summary and Conclusion
The US intends to achieve net-zero emissions in various sectors in the future. This paper explores its efforts and milestones in achieving this dream. It began by examining its total production of key sources of green energy. It used data-driven insights to determine their growth trajectories and contributions to the energy mix.
The US has made efforts to facilitate significant growth in the generation and supply of these forms of electricity. Solar and wind energy have now emerged as better alternatives, supplying various sectors in the US with power. These innovations present an opportunity for the US to reduce its reliance on fossil fuels. It can reduce greenhouse emissions and limit global warming to sustainable levels. The country requires concerted efforts across various sectors and investment in technology to attain its goal.
The study identified several benefits of adopting clean energy sources in the US. These innovations promise environmental sustainability, public health improvements, and economic growth. However, some challenges that they face include intermittency, grid integration, and regulatory barriers. The US can address these issues by advancing grid infrastructure and offering financial incentives. They can also conduct comprehensive land use planning and foster technological innovation and research.
Conclusion
The US can leverage renewable energy to achieve a sustainable and resilient future. Green energy sources have become appropriate solutions to combat climate change. They have the potential to enhance energy security and drive economic growth worldwide.
It is an opportunity for the country to lead the global transition towards a low-carbon economy. It influences environmental sustainability and public health improvements. However, they encounter many challenges that slow their widespread adoption.
The US and other nations can leverage technological advancements and foster collaboration among stakeholders to accelerate this transition. This can pave the way for a cleaner and greener future for generations to come. Therefore, achieving the emissions target requires collective action and commitment from groups across nations and globally. The US needs to encourage its citizens to rise to the challenge and seize the opportunities available to them.
References
[1] T. Kara and A. D. Şahin “Implications of climate change on wind energy potential.” Sustainability, vol. 15, no. 20, 2023.
[2] W. Strielkowski, L. Civín, E. Tarkhanova, M. Tvaronavičienė, and Y. Petrenko, “Renewable energy in the sustainable development of electrical power sector: a review.” Energies, vol. 14, no. 24, 2021.
[3] G. T. Chala and S. M. Al Alshaikh, “Solar photovoltaic energy as a promising enhanced share of clean energy sources in the future—a comprehensive review,” Energies, vol. 16, no. 24, 2023.
[4] Y. Kurdi, B. J. Alkhatatbeh, and S. Asadi, “The influence of electricity transaction models on the optimal design of PV and PV-BESS systems,” Solar Energy, vol. 259, pp. 437-451. 2023.
[5] Y. Lu, Z. A. Khan, M. S. Alvarez-Alvarado, Y. Zhang, Z. Huang, and M. Imran, “A critical review of sustainable energy policies for the promotion of renewable energy sources,” Sustainability, vol. 12, no. 12, pp. 1-65, 2020.
[6] S. Tabassum et al., “Solar energy in the United States: development, challenges and future prospects,” Energies, vol. 14, no. 23, 2021.
[7] H. Mao et al., “Advances and prospects on estimating solar photovoltaic installation capacity and potential based on satellite and aerial images,” Renewable and Sustainable Energy Reviews, vol. 179, 2023.
[8] R. Brill, “How Much Do Solar Panels Cost?” Forbes Home, 2022.
[9] M. G. Fikru, “Estimated electricity bill savings for residential solar photovoltaic system owners: Are they accurate enough?” Applied energy, vol. 253, 2019.
[10] G. Orentas, “Washington solar incentives, tax credits and rebates of 2024,” Forbes Home, 2024.
[11] M. Gavin, “US wind power generation on course to surpass coal,” Reuters, 2023.
[12] J. Dorrell and K. Lee, “The cost of wind: negative economic effects of global wind energy development.” Energies, vol. 13, no. 14, 2020.
[13] E. Garcia, “U.S. tax credits set to spur bigger wind farms, new siting strategies,” Reuters, 2022.
[14] J. Agra Neto et al., “Factors influencing the decision-making process at the end-of-Life cycle of onshore wind farms: a systematic review,” Energies, vol. 17, no. 4, 2024.
[15] G. C. Holdren and K. Turner, “Characteristics of Lake Mead, Arizona–Nevada,” Lake and Reservoir Management, vol. 26, no. 4, pp. 230–239, 2010.
[16] “Hydropower Explained,” Energy Information Administration, 2023.
[17] NS Energy Staff Writer, “Hydropower: Top hydropower producing countries in the world,” NS Energy, 2018.
[18] A. B. Lovins, “US nuclear power: Status, prospects, and climate implications,” The Electricity Journal, vol. 35, no. 4, 2022.
[19] “U.S. Nuclear Industry,” US Energy Information Administration, 2023.
[20] S. Kosai and H. Unesaki, “Quantitative evaluation of security of nuclear energy supply: United States as a case study,” Energy Strategy Reviews, vol. 29, 2020.
[21] M. A. Raza, M. M. Aman, A. H. Rajpar, M. B. A. Bashir, and T. A. Jumani, “Towards achieving 100% renewable energy supply for sustainable climate change in Pakistan,” Sustainability, vol. 14, no. 24, 2022.