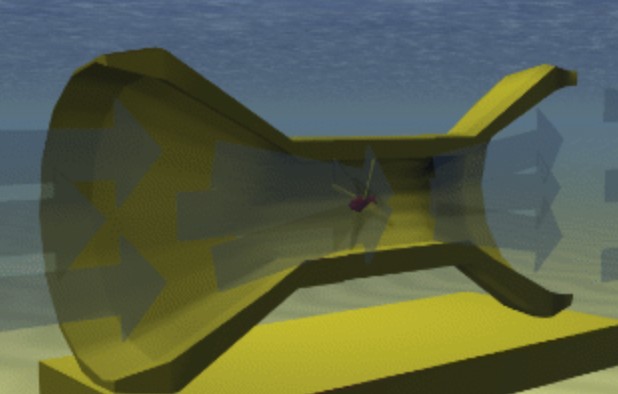
The Venturi effect is of particular importance in fluid dynamics, characterizing the pressure drop of a fluid as it flows through narrow spaces. The Venturi effect is named after the Italian scientist Giovanni Battista Venturi, who is also known for his work in optical physics (Gallitto et al., 2021). The Venturi effect determines the hydrodynamics in heterogeneous tubes, whose cross sections differ from each other. If one refers to Fig. 1, one can observe an example of such a tube: the cross section of the central part turns out to be significantly smaller than the cross-section at the edges of cone-shaped regions. In simple words, the pipe narrows in some places and expands in others — space inhomogeneity is a key requirement for the realization of the Venturi effect.
An explanation of the Venturi effect can be realized from two sides: through velocity vectors and through Bernoulli’s equation. In terms of velocity vectors, the motion of fluid molecules is physically restricted because the tapering walls of the pipe prevent active flow (Shi & Nikrityuk, 2020). As a
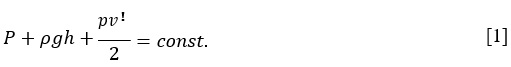
consequence, the velocity vector is reoriented towards the direction of least resistance. Since any fluid is represented by a huge number of such molecules, the total velocity vector converges as the space in the pipe shrinks, which creates an increase in the flow velocity. However, it is possible to consider the Venturi effect from another side, namely as a consequence of Bernoulli’s equation [1]. In equation [1], it is shown that the sum of pressure P with the product of density ???? by height h and acceleration of gravity g, as well as with the half-product of density by the square of velocity v, is a constant value.
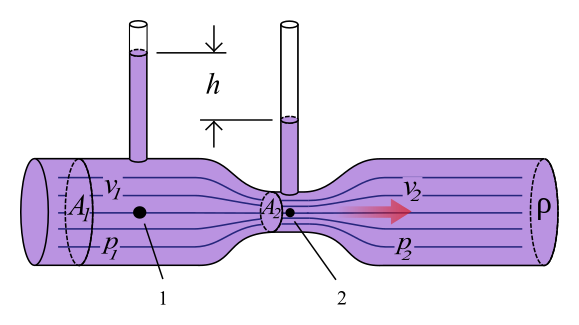
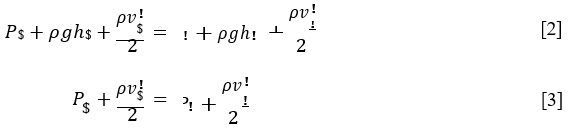
Bernoulli’s Equation can be used in practice to demonstrate why the pressure decreases as the speed of the molecules increases. Figure 2 shows two points from areas with different cross sections. For both points, the expression from Bernoulli’s Equation applies, and therefore Equation [2] is valid. Since points 1 and 2 are on the same height, the terms associated with height are excluded. Since it has already been determined that the flow velocity in a narrow space increases, the term ! naturally ! increases on the right-hand side. In turn, since equality [3] determines the constancy of this expression, it follows that the pressure P2 must decrease in response to an increase in velocity. In other words, the Venturi effect determines that the pressure of the flow of a non-viscous and incompressible fluid decreases due to the increase of its velocity through the narrowing spaces. In turn, in response to a decrease in pressure in a narrow space, the fluid cannot also push air out much, and as a result, ∆h is observed in a measuring device based on the physics of communicating vessels.
The Venturi effect finds its application not only in laboratory tests but also widely used in the applied sense. For example, if one compresses a water hose with a finger, that is, artificially creates a constriction of the tube, the speed of liquid flow increases, and the pressure decreases. In addition, the effect also works in relation to air masses when the wind speed increases in the space of the city as a result of dense development. The pressure differential caused by the Venturi effect is also used: when a fluid flow with higher velocity enters a narrower space, it results in a vacuum. In contrast, by measuring the pressure of the fluid, including the height of the column, the flow velocity can be calculated, allowing the flow rate to be determined. Thus, the Venturi effect is widely observed in nature and is actively used in the laboratory. This report examines the results of a laboratory study of the Venturi effect.
Methodology
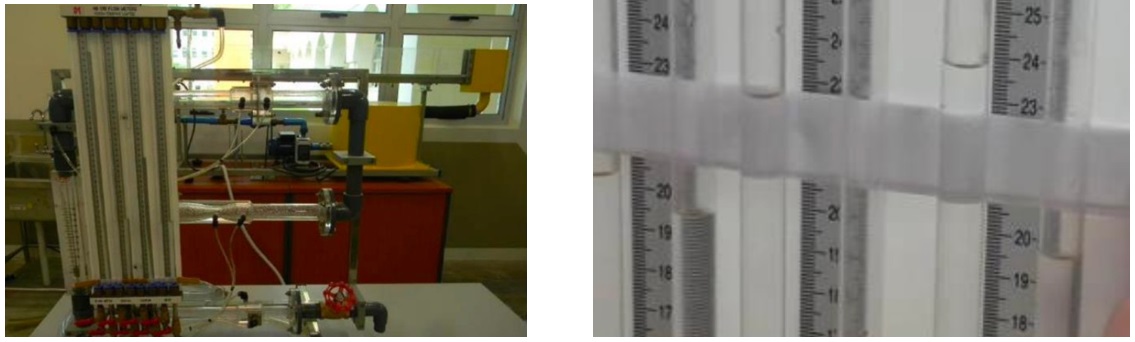
The design of this study is based on an experimental paradigm to obtain preliminary quantitative results and analyze them. Figure 3 shows an example of a device that could be used to observe the Venturi effect. The flow rate or flow rate was controlled by means of a red tap at the bottom of the unit connected to the fluid source. Several experiments were performed depending on the actual flow rate of the fluid controlled by the red tap. The liquid was discharged into a measuring flask upon reaching the 0.012 m3 mark, in which the experiment was terminated. Different sections of the heterogeneous pipe were connected using vessels to the meter, which allowed to determine the height difference when the uniform flow was established. Based on the height difference and the time required to fill the measuring flask with 0.012 m3 of liquid, calculations were made, and the patterns associated with the Venturi effect were determined.
Results and Discussion
The present laboratory work was designed to investigate the Venturi effect in terms of determining the actual flow rate of the fluid and investigating the relationship between height difference and flow velocity. The height difference measured from the liquid column by means of a ruler was evidence of
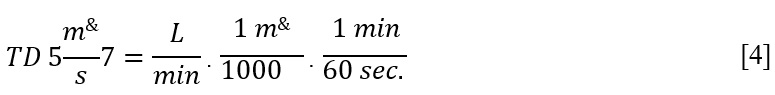
the pressure drop resulting from the flow moving into the narrower space of the pipe. Table 1 below shows the results of the direct measurements of the height difference measured in meters. Primarily it can be seen that the height difference decreases as the experiment progresses — given that the flow rate was decreasing, one can conclude that as the fluid head decreases, so makes the pressure difference between the different sections of the heterogeneous pipe. Since the fluid flow rate was measured in l/min, it was paramount to convert the value to m3/s. For this purpose, the formula shown in equation [4] was used.
Table 1. Results of Measurement of Height Difference and Calculation of Theoretical Fluid Flow Rate.
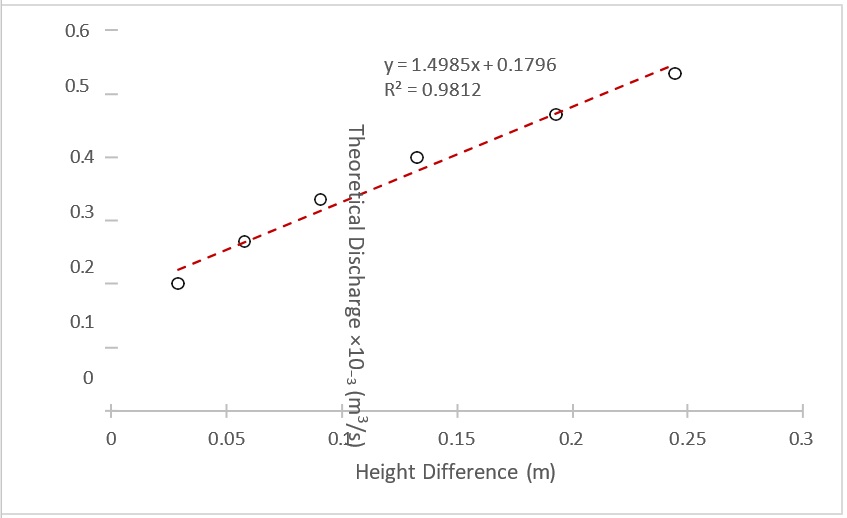
Dependence between height difference and flow rate was measured with MS Excel. Figure 4 presents a graph of this functional relationship: in general, it can be seen that as the height difference increases, so does the theoretical fluid flow rate, and vice versa. It is well seen that the relationship between the variables is not strictly linear, as the flow rate increases non-uniformly as the height difference
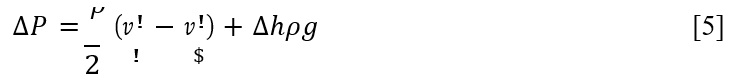
increases. If one again refers to Bernoulli’s equation but slightly rewrite it, one can obtain equation [5]. This transformation clearly shows that the relationship between the two variables is actually quadratic; that is, the height difference (pressure difference) is defined as the difference in squares of velocities (flow rates) and vice versa, and the fluid flow velocity difference is defined as the square root of the pressure difference. Indeed, a linear relationship from Bernoulli’s equation is found for the pressure difference as a function of fluid density since these variables are related in direct proportion.
In addition, measurements were made of the rate at which the liquid was drawn into the measuring flask depending on the actual liquid regulation with the red tap. Table 2 shows the results of such measurements for each of the tests, given the time taken to reach a volume of 0.012 m3. It can be well seen that the obtained values of practical fluid flow are generally similar to those found theoretically,
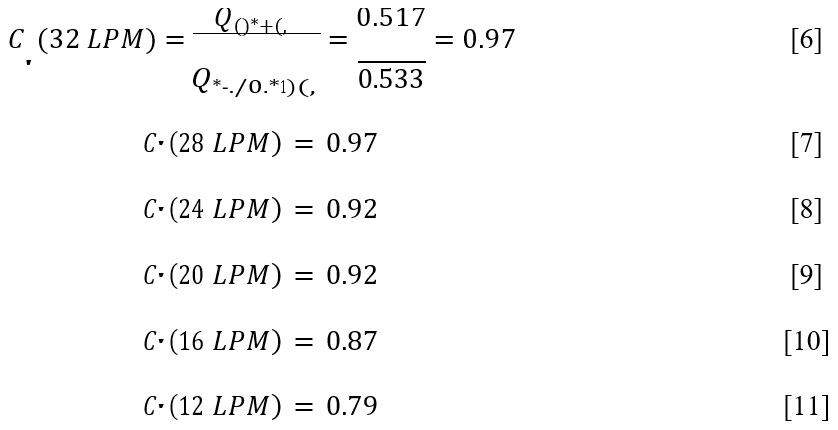
taking into account the Bernoulli equation, but do not repeat them completely. The maximum difference between the two results was actual for the lowest fluid velocity (12 LPM), at which the difference between theoretical and actual flow rates was up to 21.4%, and the minimum was only 3.0% for the maximum fluid velocity. Equations [6]-[11] show the calculation results for the actual difference between the values.
Table 2. Results of Direct Measurements of Time and Actual Fluid Flow Rate.
Potential sources of error associated with the divergence of the determined flow rate through the Venturi effect prism is the treatment of the fluid as a perfectly incompressible model, which in reality is not the case. In addition, this experiment was associated with several limitations, namely the lack of consideration of temperature effects on the fluid, the lack of verification of the applicability of the results to fluids other than water, and the non-automated time-keeping system leading to the accumulation of errors.
References
Felföldi, A. (2021). What is the Venturi effect? SimScale.
Gallitto, A. A., Zingales, R., Battaglia, O. R., & Fazio, C. (2021). An approach to the venturi effect by historical instruments. Physics Education, 56(2), 1-12.
Neill, S. P., & Hashemi, M. R. (2018). Fundamentals of ocean renewable energy: Generating electricity from the sea. Academic Press.
Shi, H., & Nikrityuk, P. (2020). The Influence of Inflow Swirl on Cavitating and Mixing Processes in a Venturi Tube. Fluids, 5(4), 170-180.