Introduction
Description of Scenario
This case study involves a chartered organization by the US government called the Paralyzed Veterans of America (PVA). According to the case study, PVA is a philanthropic organization that focuses on serving the needs of American veterans who have suffered from spinal cord diseases and injuries (Stephenson & Taylor, 2021). Established in 1946, PVA raises money to support the Veteran’s healthcare advocacy, insurance cover, education and research involving spinal injuries and diseases (Stephenson & Taylor, 2021). The organization raises money by sending mails, postages, and requests for donations through gifts.
However, a majority of their donation comes from direct mailings, where the organization sends greeting cards or free address labels to potential donors and requests for donations once the gifts are received (Hanks, Wright, & McKinnon, 2021). In 2016, the organization received more than $100 million from its donors. Out of this amount, $40 million was spent by the organization on postages (DeVeaux, Sharpe, & Velleman, n.d.). However, due to the solicitation of mails by the donors, the organization established that only a few donors responded.
Analysis Plan
Problem Statement
The organization wants to increase the donations received and would like to model the amount received based on the demographic and past giving variables of their donors. To be more efficient, PVA seeks to establish how demographic variables and past giving have an impact on future donations. Therefore, this analysis is based on the research question: what is the impact of demographic factors and past giving variables on future donations?
Quantifiable Factors
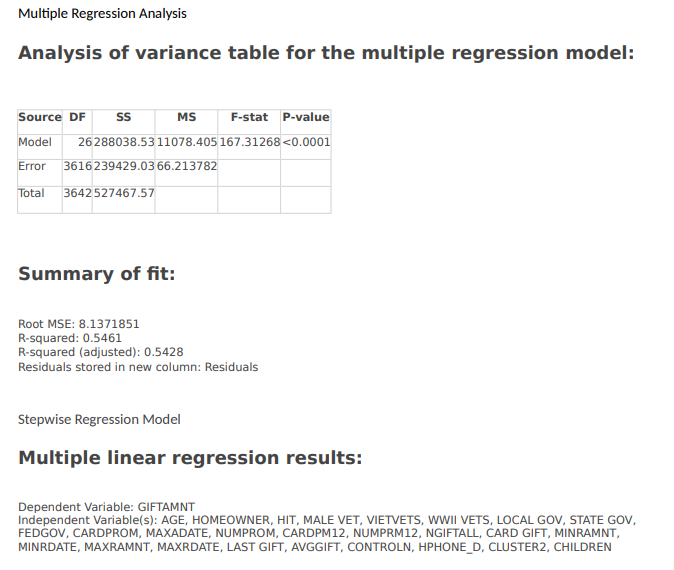
Quantifiable factors are defined as the outcomes from actions that are measurable in numeric terms. The dataset provided to support this case study has information on 3,648 donors who are involved in a recent solicitation, 26 predictor variables, and one response variable. According to Pugsley (2017) when undertaking this analysis, it is paramount for PVA to identify the most important data to use and what variables to be included in the analysis. In this assignment, the selected quantifiable variables must include data that will measure the number of donations received by PVA. Consequently, in this analysis Gift Amount, Last Gift, AvgGift, NGiftAll, and NumProm are selected as the response variables. Moreover, the inclusion of variables identifying the donors during the last solicitation is paramount. In this assignment, MaleVets, LocalGov, VietVets, Homeowners, StateGov, and FedGov will be used.
Strategy
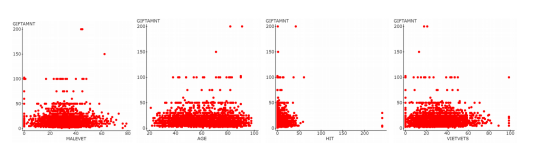
An appropriate strategy that PVA can use is to create scatterplots that will be used to measure the GIFAMNT against the predictor variables. The assignment is founded on the assumption that through scatterplots and regression analysis, PVA can help solve the problem of how to reduce the cost of mailings by determining the most cost-effective donor group (Shao et al., 2017). Below are screenshots of the six major variables.
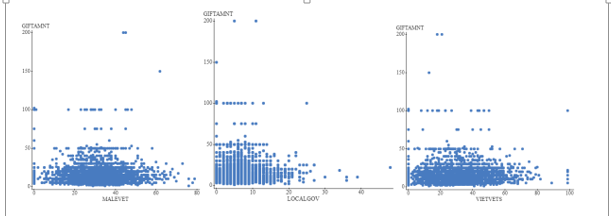
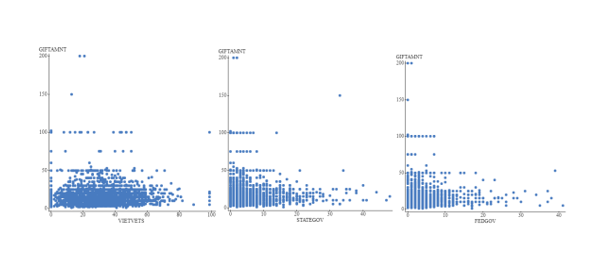
In creating the above scatterplots, each variable is first placed in a Statcrunch. The independent variable was placed on the X-axis since it was not affected by manipulation while the dependent variable was placed on the Y-axis since it was affected by manipulating the X-axis (Pokhariyal, 2019). Scatter plots for all the future predictor variables were created as shown above. As evidenced above, the first scatterplot shows the relationship between GIFTAMNT and MaleVets which shows the average amount of gits received from male veterans is slightly below $50.00.
The other five scatterplots can be analyzed in the same manner. From the scatterplots, the organization is able to determine which donors they will send mailings and postage to base on future donations and previous campaigns. Therefore, using Statcrunch is an effective way for PVA can perform regression analysis and predict future donation behaviors for different donor groups.
Statistical Method
The statistical method that will be used in this analysis will help PVA to predict future donations by exploring demographic factors and past donations trends using regression analysis. Consequently, by running a regression analysis, the PVA is likely to predict the next group of donors and thus send mailings and postages without incurring costs (Foley, 2018). The first step in regression analysis is to run a correlation matrix test to see which of the 26 factors is positively correlated to the GIFTAMNT and to what extent.
Furthermore, a multiple regression analysis is done using the p-values of each variable to determine if the factor will be included in the final regression equation (Foley, 2018). In this analysis, StatCrunch and Microsoft Excel are appropriate tools since they comprise a collection of statistical and mathematical formulas that allows PVA to analyze large volumes of data. The Excel Data Analysis tool is convenient to use in this analysis.
Variables
Variables play a significant role in data analysis. In this particular case, the focus was mainly on the relationship between GIFTAMOUNT and other variables while the goal of the organization was to establish whether there existed a correlation between demographic and past giving behavior with future giving. Consequently, each of the six scatterplots presents a unique way of understanding how each variable could help in addressing the research question. On the created scatterplots each independent variable had no effect on the X-axis and the dependent variable on the Y-axis. This indicates that the average amount of gifts a PVA can receive from male veterans is under $50.00. This scatterplot must be able to assist PVA in its determination (see MALEVET variable). This indicates that the average prize amounts a PVA can receive from a male veteran is under $50.00.
Data-Driven Calculations
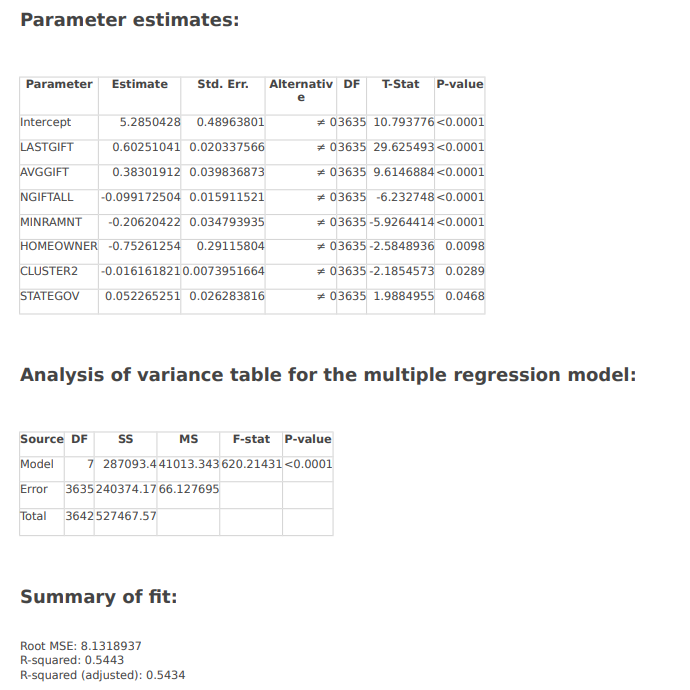
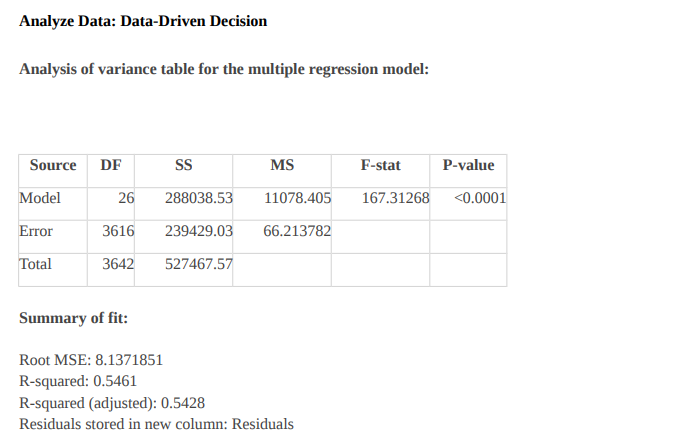
Through regression analysis, one shall attempt to show the relationship (whether dependent or not dependent) between the predictor and response variables. First, the analysis will run an independence test between the variables. Second, a regression test to determine the causal effect (Zhao & Hastie, 2021) of the dependent variable will be conducted. The p-values are set to equal to <0.0001.
Since the used p-value is <0.05, then one can conclude that donor characteristics and GIFTAMNT are not independent. Further, since the two are not independent, one can conduct a regression analysis between the two variables to predict future trends (Gunst & Mason, 2018). On the other hand, the calculated R square is 54.61% which means that more than half of the variation in donor characteristics is related to gift amounts (Karch, 2020). This means that PVA can predict the causal relationship between donors and their characteristics to predict future donation behaviors.
Solution and Conclusion
The regression model showed that 54.34% of the variance in donor characteristics was associated with the number of gifts. Therefore, it can be argued that through this regression analysis, PVA is able to track donors’ behavior, thereby creating an efficient way of targeting these donors. The organization will target the donors to give priority and determine who will receive personalized attention in its annual campaigns. Besides, the analysis suggests that by reducing the number of mails and postages, the organization will improve its fundraising performance as it will save the amount spent on administration, buying gifts and mailings. Indeed, if PVA can save on some of these costs, it will reallocate the funds to programs that directly benefit disabled veterans.
References
DeVeaux, D., Sharpe, N., & Velleman, P., (n.d.). Pearson MyStatLab. Pearson Publishers.
Foley, B. (2018). What is regression analysis and why should I use it? Web.
Gunst, R. F., & Mason, R. L. (2018). Regression analysis and its application: A data-oriented approach. CRC Press.
Hanks, M., Wright, A. E., & McKinnon, J. (2021). Wounded veterans in parks and the joint recovery team: American veterans in underwater archaeology. Journal of Veterans Studies, 7(1). Web.
Karch, J. (2020). Improving on adjusted R-squared. Collabra: Psychology, 6(1). Web.
Pokhariyal, G. P. (2019). Importance of moderating and intervening variables on the relationship between independent and dependent variables. International Journal of Statistics and Applied Mathematics, 4(5), 1-4. Web.
Pugsley, T. S. (2017). An implicit model development process for bounding external, seemingly intangible/non-quantifiable factors. Naval Postgraduate.
Shao, L., Mahajan, A., Schreck, T., & Lehmann, D. J. (2017, June). Interactive regression lens for exploring scatter plots. John Wiley & Sons.
Stephenson, P. L., & Taylor, M. V. (2021). Consumer health information for spinal cord injury and paralysis. Journal of Consumer Health on the Internet, 25(1), 102-111. Web.
Zhao, Q., & Hastie, T. (2021). Causal interpretations of black-box models. Journal of Business & Economic Statistics, 39(1), 272-281. Web.
Appendices
Summary of Data-driven Decision
Multiple Regression Analysis
Parameter Estimates