Introduction
Most of the organizations are required to maintain books of accounts so as to comply with the regulations and laws in the Company’s Act. The importance of keeping books of accounts is to ensure that the transactions that take place within an organization are carried accurately and at the appropriate time.
Company History
Exxon Mobile Company is a company that deals with the selling and purchasing of products such as oil and gas. It is one of the largest companies in the world and has been recording improvement in its performance for a long time such that it has recorded revenue amounting to $404.5 million as of 2007. Its market capitalization was $501.7 billion as at April 2008.By the year 2007, it had over 72 billion oil-equivalent barrels of oil that were expected to last for a period of 14 years. The above reports are a true indication that the management of the company has been utilizing its resources effectively and that is why it has recorded drastic improvements in its performance.
According to Sam, he noted that in the year 1998, Exxon and Mobile companies signed an agreement that amounted to United States dollars of $73.7 billion so that they could form the Exxon Mobile Company. This agreement was initiated after the shareholders and regulatory bodies approved the mergers. The two companies were large enough such that they formed one of the largest companies in America whose headquarters are located in Irving Texas.
It was noted that it consists of subsidiary companies such as Imperial Oil Limited in Canada, Sea River maritime, and the petroleum shipping company that ensure that customers’ needs are satisfied as they occur. Its employees are over 82,000 while others have been employed in various branches of the company in the world. It’s divided into global operating divisions such as; the upstream division that deals with oil exploration, extraction, shipping, and wholesale operations that are based in Houston, Texas that enhance activities to be carried out effectively. The downstream division deals with marketing, refining, and retail operations that are carried out in Fairfax and Virginia areas while the company’s chemical division is based in Houston and Texas areas.
Financial ratio analysis
In the year 2000, the management of the Exxon Mobile Company decided to sell some of its assets so that it could obtain new assets that would produce good quality goods for its customers. For instance, it sold refineries in Benicia in California and 340 Exxon branded stations and the Valero Energy Corporation in California.
According to Charles, he states that financial ratios are used to evaluate how a company is performing in the industry as well as determining its financial situation. Trends of a company within an industry can be evaluated with the use of different kinds of ratios. They are classified into liquidity, asset turnover, solvency, profitability, and market test ratios of a firm.
Liquidity ratios
These are the ratios that are used to determine how well a firm can meet its short-term financial obligations as they occur within a financial period of a company. They are classified into current ratios or the working capital ratios and the quick ratio.
Current ratio
This is the ratio that shows the number of current assets that can be used to cover up the current liabilities that occur within an organization. Current assets involve cash, account receivables, and notes receivables while the current liabilities involve overdraft, accruals, trade credit, provision for taxation, and proposed dividends (Mark 15–29).
Current ratio= current assets / Current liabilities
This ratio can be used by investors to determine how risky the business they are venturing is in the market. Shareholders also use this ratio because they consider that a firm can be in a position to run its operations in an effective manner. The demerits of this ratio consist of inventory that cannot be easily converted into cash since it ties up cash that can be used to meet a firm’s short-term obligation as they occur.
According to analysis carried out to ExxonMobil it showed that it was in a position to pay up its debts as they arose in every financial year. This is because it ratio was constantly high although it has been declining from the year 2005 to 2007. The ratio would have also shown poor credit management policies as cash would have been tied up in form of inventory therefore could take a longer time to meet the needs of the customers.
Quick ratio or the acid ratio
It is the ratio that does not include inventory when being calculated. It’s deducted from the current assets, as it cannot easily liquidate into cash. An asset is said to be liquid if it can be converted to cash without losing value at any circumstance.
It is calculated as =Current assets-Inventory / Current liabilities
It was noted that the past five years in quick ratio has been increasing therefore it shows that the management of the company were utilizing their resources effectively.
Accounts receivables collection period
It is a ratio that is used for recording the number of day’s accounts receivables can be collected. This ratio is used to determine how well a company has utilizes its credit policies to run the operations of a firm effectively.
It is calculated as: = (Accounts receivables *365 days) / Sales
During the years 2003 the ratio was higher than that of 2006 this showed that it had its mode of collecting debts from its customers was improving therefore could compete effectively in the world market.The other effect of this ratio is that sales of company would decline to having less customers owing them debts that can be repaid in the future (Mark 15–29).
Inventory turnover
It is a ratio that is used in determining the number of times a firm can convert its inventory into cash that later on leads to generation of profits within a stipulated period of time.
It is calculated as: Inventory turnover = Sales / Total inventory
It was revealed that inventory turnover ratio was increasing each financial period of the company. The increase showed that the company was in a position to convert its inventory into cash at a faster rating hence generated more revenue to the company.
Profitability ratios
These are the ratios that are used in determining whether a firm can generate profits or not within a stipulated period of time. They evaluate how a firm uses its assets and controls them in order to generate the acceptable returns for an organization. It also shows how efficient a firm is while carrying out its operations.
Gross profit margin
It is the ratio that is used to assess the number of profits that should be earned by a firm within a stipulated period of time. The ratio is also used in determining how a company is efficient in running its operations.
It is calculated as: =sales-cost of goods sold / Sales
Financial statements of Exxon mobile company showed that during its last five year period its gross profit margin was increasing, but at a very slow rate. This was an indication that the company was operating cost of production was low and utilized its management policies effectively.
Operating Income
It is also referred to as earnings before interest and taxes ratio (EBIT) that measures the profitability of a company within a financial period of a company. It also represents a firms earning power that results from undertaking activities within an organization.
It is calculated as: = (Operating Income*100) / Net Return
Income before tax
It is a ratio that is used by the management of a company to indicate the amount of profits that a firm can generate before its taxes are submitted to the taxation authorities’.
It is calculated as = (Operating Income *100) / Net Revenue
Net Profit
It is a ratio that is used to determine how well a management can run its operations profitabitably with low manufacturing and operating costs.
Net Profit %= (Net Income*100) / Net Return
The ratio was constant through the five years of its operations, this was an indication that Exxon mobile company was in a position to control its operating costs, manage its assets activities therefore was in a position to derive profits from running the affairs of the organization ( Mark, pp. 15–29).
Asset efficiency
These are the ratios that show how well a company utilizes its assets to generate revenue that enhance growth and development within a company.
Return on total asset before tax
This is a ratio that shows how affirm utilizes its assets to generate profits for an organization. When the ratio is high it means that a firm is uses its assets for the right purposes.
It is calculated as = (Income before tax *100) / Total assets
Return on shareholder equity before tax
This is a ratio that is used to show the returns that the shareholders may generate after it has invested money in a company.
Return on shareholder equity before tax= (Income before tax *100) / Shareholder equity
Total asset turnover
It is also another ratio that is used to indicate how well a company can utilize its assets in order to generate profits for an organization.
Total asset turnover = Total net revenue / Total assets
According to the analysis it was revealed that the management of the company continually utilizes its assets to generate income hence the greater returns were shown during the five year accounting period (Mark, pp. 15–29).
Fixed asset turnover
This is a ratio that indicates how well a company uses its fixed assets to increase earnings for an organization. If ratio is high it means that a firm does not have so many idle assets, but all are used for generating revenue for an organization.
Fixed asset turnover =Total net revenue / Fixed assets
Solvency ratios
It shows the company’s ability to generate cash flow and its ability to meet its financial obligations as they arise. It includes financial leverage ratios that show the long-term solvency of a firm.It includes debt ratio, debt to equity ratio and the time interest earned. It is classified on the basis of the long-term lease and debt or equity of an organization.
Debt to equity
This is a ratio that shows the amount of money that creditors owe a company so that it fulfills its obligations as they occur (Mark, pp. 15–29).
Debt to equity ratio is calculated as: total debt / Total equity
Analysis of Exxon mobile company revealed that this ratio was low therefore the management of the company could be in a position to flourish during the economic boom conditions. The company’s share s prices were high as per stock exchange index due to low risks associated in investing in the company.
Time interest earned
This is a ratio that is used to indicate affirms ability to clear up its interest charges as they arise. The ratio was high as from 2003 up to 2006 this showed that company could service its interests on time therefore investors would be confident in the operations of the company.
It is calculated as =Operating income / Interest expense
Market Tests
According to Low she stated that market test ratios are used to measure cost incurred as a result of issuing stock to the shareholders and the cost of issuing company’s stocks to the investors. It includes payout ratio and price per earnings ratio. Payout ratio is the ratio that is derived as a result of determining dividends generated within a firm versus the earnings earned within a stipulated period of time. It is also generated through dividing dividend per share by the earnings per share. Price earnings ratios are calculated through dividing prices earned by the earnings per share.
Earnings per share
It is a ratio that is used to show the number of shares an investor can earn as result of investing money in a firm. (Mark 15–29)
It is calculated as: = Net income available common shareholder / Number of shares outstanding
Price earnings ratio
It shows how a company can pay up its costs of investments. It is used by the investors to compute shares that are issued to the public.
It is calculated as= Current market price of stock / Earnings per share
Dividend yield common stock
This is a ratio that is used to indicate the amount of dividends that a company can pay its shareholders. It is usually set by the management according to the earnings generated in a specified financial period of a firm. The current and future dividends of a firm may not be the same because the future performance of company cannot be dictated accurately by the management.
Dividend yield common stock=Dividend per share / Current market price of stock
The use and limitation of financial ratios
Financial ratios are used in comparing the performances of different kinds of firms within an industry. The seasonal factors may exist as they either increase or decrease the amount of balances that may occur before the year-end of a financial company. The use of varying results may lead to generation of varying results for an organization
The different accounts in the balance sheet.
A balance sheet is a financial statement that is used to give a detailed explanation of the firm’s assets, liabilities and its shareholders. It also shows a firm’s financial position within a stipulated period of time.
Horizontal analysis
It analyzes the financial information of an organization using the financial ratios through comparing specific items within the financial statements. The methods that are used in undertaking the horizontal financial analyses involve: absolute dollar method and percentage that is expressed in percentage form that involves analyses of financial statement.
Assets
These are items that are considered to be valuable within an organization. The management of an organization uses them to make products or to provide services to the customers so that they can access facilities that are within their reach. They are divided into current and noncurrent assets, where current assets can be easily converted into cash within a year for example, and the inventory while noncurrent assets are also referred to as fixed assets that help an organization in running its operations. Fixed assets involve items such as: plants, trucks, equipment and other property.
Company’s assets increased by 5.1% although the cash and cash equivalents declined by 1.5% during the same year while notes and accounts receivables also increased by 5.3%. Accounts receivables increase in value was an indication that the company was having trouble in collecting debts from its customers. This was as a result of poor credit terms as they contributed to lower earnings for the company.
According to Sam he noted that ExxonMobil’s inventories rose by 14.4% and 18.1%respectively due to availability of crude inventory materials and supplies. The effect of increased inventories was as a result of tying up of cash in firm stock due to poor selling techniques. Even if the inventories were more, they would be sold in the future and therefore remained valuable assets within the organization. Since the oil prices increased, it led to increased value for inventory hence higher returns for the organization. It was reported that current assets, investments and advances rose by 3.3% and 12.8% respectively in the year 2006 which showed speculative profits that resulted from poor management of management policies.Its fixed assets such as property, plant and equipment rose by a faster rate as compared to the sales and current assets. Its rate of investment declined due to lack of knowledge and skills of exploration methods, as they would have contributed to higher returns for the organization.
Liabilities
They indicate amounts of money owed by a firm as a result of borrowing from financial institutions to run the operations of an organization. They are divided into current and long-term liabilities. Current liabilities are liabilities that owed for a period of one year for example, the account payables and notes payables. Long-term liabilities involve liabilities that should be paid up after a period of more than one year such as loans. It includes money borrowed from the financial institutions such as banks, micro finances and mortgage companies.
According to Trent, he noted that notes and loans payable in the year 2006 declined by 3.9% while the long-term debts were repaid and replaced with debt of longer maturities. The accounts payable increased by 8.2% because of late purchase of inventories and purchasing of credit led to higher accounts payable. The long-term liabilities such as long term debts and earnings owed by minority investors increased faster than assets while the deferred tax liabilities also declined.
Shareholder equity
Its amount of money an owner of a business derives after investing in his business. The earnings generated may be distributed to the shareholders in form of dividends. It is achieved through deducting the assets owed by a company by its liabilities.
The management of the company issued new stock to the customers that resulted in increased the common equity of $309 million hence the capital of running the affairs of the company increased. The amount was as a result of change that was brought about by the stock based compensation. It was later on purchased again at $28 billion of stock according to the treasury account figures. The share buyback was contrary to the contributions that were made to the shareholder equity that resulted to 2.4% increase in total shareholder equity.
Risk assessment management industry
This process involves evaluating the degree of risk through determining its probability of its occurrence and potential impact. A risk refers to the uncertainty that occurs that may have an impact on an event. The risks may be classified as being of high probability risk, low probability of risk, high potential for loss and events that have low potential for loss.
According to Cooper 2002 he stated that the risk management tools are used to evaluate firms’ likelihood of incurring a risk through using the loan packages and alerts that show any doubtful situations that may occur within an organization. Personal risk management tool is a tool that is used in evaluating a company’s liquidity, collateral and credit history in order to determine its performance in the organization.
Commercial risk management tools are the tools that are used to analyze the financial data using the financial ratios as they are compared with the industries set standards. Risk management helps an organization to maximize on the firms’ returns and general prosperity but poor risk management leads to wrong financial commitment and leads to undetected fraud within an organization (Hastak and Baim 67-76).
Management Discussion and Analysis
This is a report that compares operating results, liquidity and financial statements that is removed in filing in the financial statements of a company with Securities Exchange Commission (SEC). It is used in communicating the manager’s ideas about the operation of the company and provides information about the operations of an entity success and challenges.
According to Sam he stated that the management discussion and analysis of Exxon Mobile Corporation showed that its net income and earnings per share increased by 17% and 25%respectively, which was an indication of higher earnings for the company. The company’s inventory such as high crude oil and natural gas realization were declined due to implementing programs aimed at lowering refining process, managing chemical production and increasing the rate operating costs of the organization. The numbers of shares outstanding were reduced through purchasing the shares in stock market.
It was revealed that prices of oil were high as they were attributed to increased cost of crude oil and product purchase which were increasing each year, but in the year 2006 there was a slight decline due to managerial problems within the organization.
Predictions regarding stock of the Exxon mobile corporation
It was reported that there would be a shortfalls in oil products due to factors such as lower crude prices, credit crises and the liquidation of hedge funds and mutual funds.
The company has been keeping enough stock for its products; therefore in case there was a shortfall in supply of the oil and gas products it would immediately deliver services to the customers. The predictions of the company’s stock is that it will last for a period of over 10 years since it undertakes exploration and development within the country that have contributed to constant supply of the produce to the customers. The recommendations that would be given to the management of the company incase its oil wells deplete in the future is that they should venture in the production of natural gases so as to compensate for depletion of oil wells in a country.
Summary
It has been noted that when the management of organization follow the rules and regulations that pertain accounting profession they can generate revenues and incomes.Extensive research should be carried out so as to ensure the right personnel are employed so that they can undertake all accounting in a more efficient manner. The performance of Exxon mobile improved due to proper utilization of its resources in an effective manner and meeting its financial obligations as they occurred.
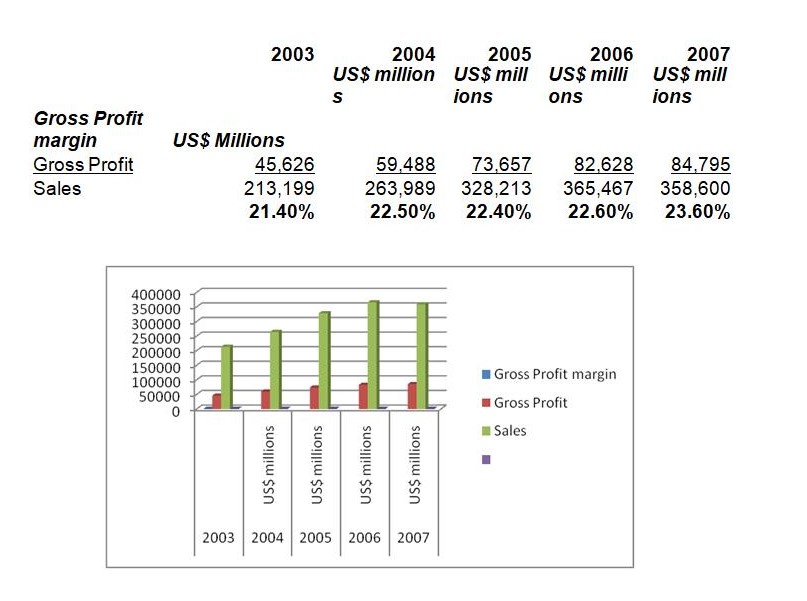
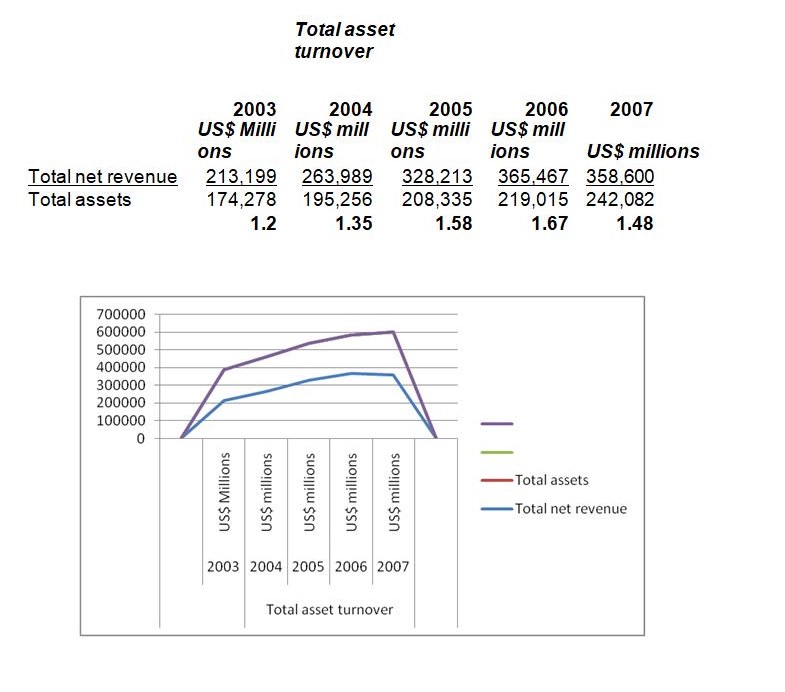 Figure 2. Total asset turnover[/caption]
Works Cited
Baruch, Lev. Financial Statement Analysis: A New Approach. New Jersey: Prentice-Hall, Inc, 1994.
Charles, Gibson, H.Financial Statement Analysis: Using Financial Accounting
Information. Cincinnati, Ohio: South-Western College Publishing, 1997.
Cooper, J.A. “Decision Analysis for Transportation Risk Management.” Cambridge: Cambridge University Press-Risk Decision and Policy, 71, 2002.
Dale Walter ,Karolak, Software Engineering Risk Management. Los Alamitos, Calif.: IEEE Computer Society Press, 1996.
Hastak, M., and Baim, E.J, “Risk Factors Affecting Management and Maintenance Cost of Urban Infrastructure.” Journal of Infrastructure Systems, 7.2001: 67-76.
Exxon Mobil Corp. (XOM: NYSE) LAST $78.11 USDCHANGE TODAY 0.00 0.00%VOLUME 0.0XOM on Other Exchanges of 2008
Exxon Income Statement.
Financial Statement Analysis Methods: Horizontal vs. Vertical Analysis.
Low, Mary 2006, Financial Statement Analysis Waikato Management School The University of Waikato.
Mark, R. Rational Markets: Yes or No? The Affirmative Case, Financial Analysts Journal, 57(3). 2001: 15–29
Oil of New Jersey. At glen, Pennsylvania: Schiffer Publishing Company,Sam, McIntyre, J. The Esso Collectibles Handbook: Memorabilia from Standard 1998.
Scott. Clark. “Financial Ratios Hold the Key to Smart Business.” Birmingham Business Journal. 2000.
Trent, William. Common Size Analysis of Exxon Mobil’s Financial Statements by: 2007 | about stocks: XOM